-
116.1k
-
1312.3k
-
3114.9k
-
37348.8k
-
36056k
-
8121.1k
-
33.5k
-
97.6k
-
1412k
-
25723.2k
-
215.8k
-
265.4k
-
334143k
-
10825.2k
-
284.5k
-
26499.4k
-
103.9k
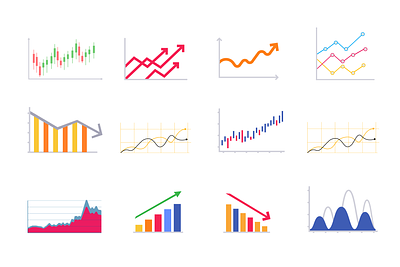


![[FREEBIE] Xiketic Charts Library v2 chart creative data vis design figma graphs kit library ui ux visualization](https://cdn.dribbble.com/userupload/13718625/file/original-d12ae6140fac34b0631eb6483fb3c3fe.png?resize=400x0)
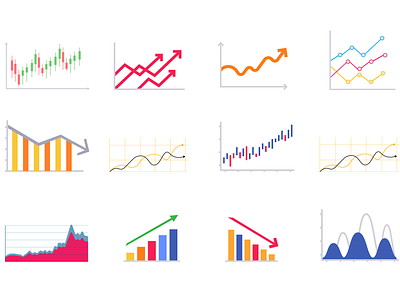
![[FREEBIE] Xiketic Charts Library v2 chart creative data vis design figma graphs kit library ui ux visualization](https://cdn.dribbble.com/userupload/13718625/file/original-d12ae6140fac34b0631eb6483fb3c3fe.png?resize=400x300&vertical=center)


Loading more…


