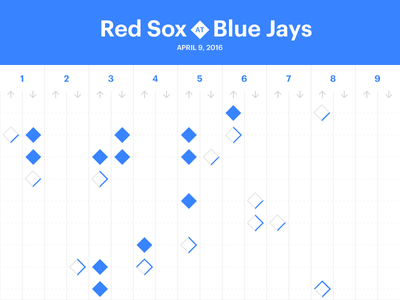
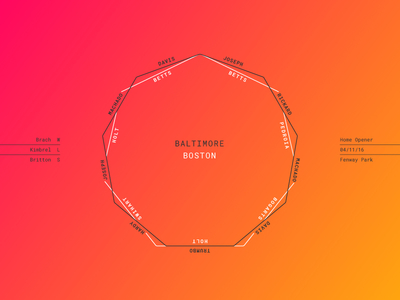
We have quite a few baseball fans at Dribbble. Red Sox fans to be more specific—since our headquarters is in Salem is short skip and hop to Boston. That’s why were excited to see Dan Perrera and Amy Parker’s project, Red Sox Scores 2016. For every Red Sox game this season, Dan and Amy will be visualizing final score for each Red Sox game this season—through data visualization, illustration, and typography. Here’s what they had to say about the project:
“We were looking for some sort of daily-ish project that would allow us to not only flex our creative muscles and play around a bit but have some actual data to design to. And of course it needed be something we’re interested in (we watch every Sox game)!”
We’ve collected a few of our favorites in the Shot Block below. Go Sox!
Shots by Dan Perrera and Amy Parker for Fore Design.
Find more Inspiration stories on our blog Courtside. Have a suggestion? Contact stories@dribbble.com.


