Line Graph with Customizable Views

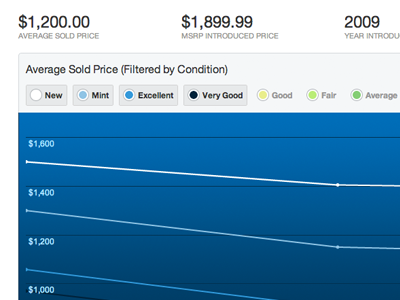
Used the Google Charts API to build a custom line graph that plots prices of products in a marketplace over time. Products sold in the marketplace can be one of 11 conditions. This interface allows for the user to choose which conditions they would like to view without ever reloading the page.