


The Lotus Chart


PRODUCT ARCHITECT
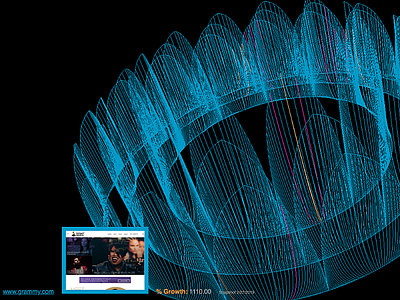
The Lotus Chart is a 3D trends visualization engine capable of showing up to 10K data points on a single screen. See it in action at https://crypto.lotus.fm.
This data-driven UI is well suited for analyzing growth rates for media properties such as music, books, and video, with additional applications for technical analysis and securities trading, real estate, and scientific literacy.
Watch my talk at the SCaLE conference in Los Angeles (March 8, 2020) here: https://youtu.be/M4epw9sipOQ
See case data from the beginning of the COVID-19 pandemic at:
https://dev.lotus.fm/red/ (worldwide cases)
https://dev.lotus.fm/green/ (US cases)
See a live interactive chart of Portland's Top 400 songs:
Mobile and assistive versions coming soon.
ROLES: Web development, animation, ux design, ux research, ux testing