


Data Visualization - Carbon dioxide

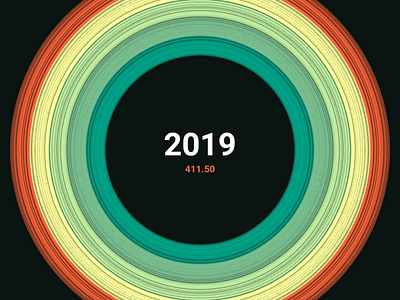
Creative coding experiment showing the monthly mean carbon dioxide (in parts per million), globally averaged over marine surface sites from 1980 to 2019 (April). Data source: NOAA/ESRL (July 8, 2019)
Watch the animation here: