Precipitation Data Visualization

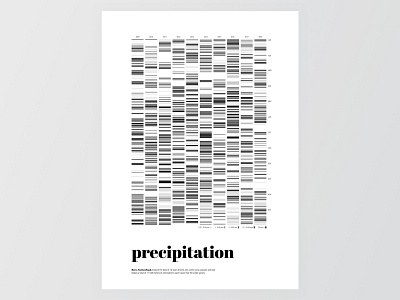
This visualization shows the precipitation data of Bern (Switzerland) from the last ten years.
It's the template for a website which creates a precipitation data poster based on where you live.
More of my work on https://chantalemesserli.ch