


Machine learning dashboard

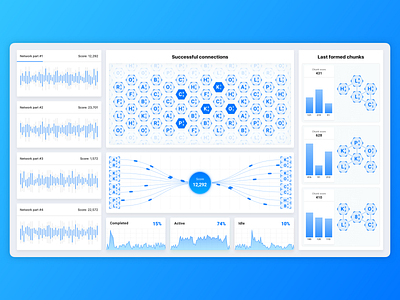
Visualization of machine learning processes. Finding combinations of successful connections and building full-level grid.
Animation: https://www.dropbox.com/s/2whgkq82snuuy7q/Animation.mov?dl=0
Visualization of machine learning processes. Finding combinations of successful connections and building full-level grid.
Animation: https://www.dropbox.com/s/2whgkq82snuuy7q/Animation.mov?dl=0