Mapping AIDS

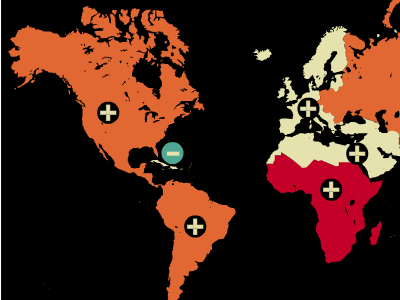
interactive infographic - icons ( = increased / decreased number of infected ) reveal more information about the number of infections.
interactive infographic - icons ( = increased / decreased number of infected ) reveal more information about the number of infections.