Daily UI 018 — Analytics Chart

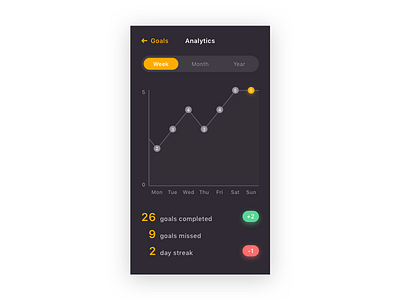
Day 18: Analytics Chart. I wanted to get some more practice with dark colors. The design is based on an idea I had a couple years ago for a daily goals app. This is the analytics screen, where the user can see an overview of how they’re doing with their goals. Tap or slide the filters at the top to see data by the week, month, or year. Below the graph is a few total stats for that time period.