


Interactive #dataviz

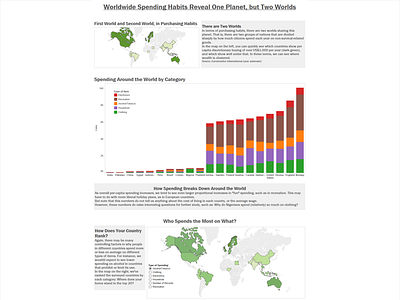
Created in Tableau (Public), I built this interactive data visualization from public data for a data-driven journalism course run by the Knight Center at UT Austin. You can see the fully interactive (and slightly oversized) original at http://twoangstroms.com/twoangstroms/2013/12/1/learning-tableau-thanks-to-datavizmooc