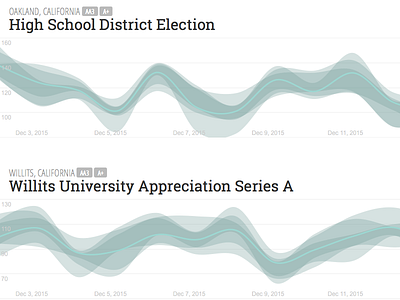
Bond price intervals
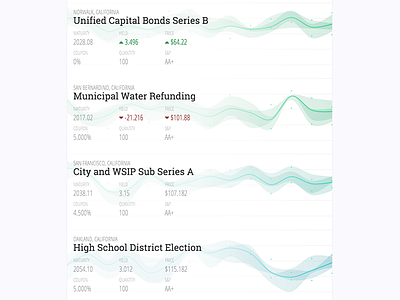
Trying to cram more data into the card view. Interval graph is simplified and made into the background since it's only used to visualize directional information, not precise trade details.
Using a gradual colour shift as "zebra striping."