Shot 051 - Shots Statistic
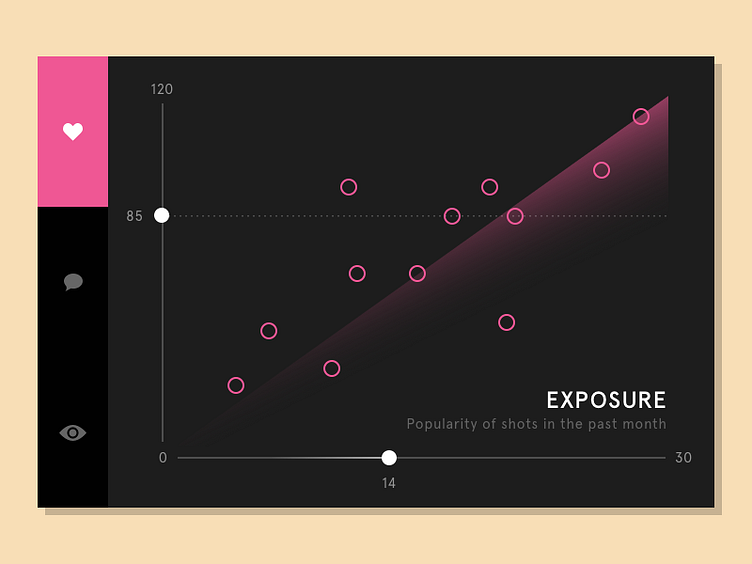
Today's upload is a graph visualisation used to see the performance of your shots over time through likes, comments and views. The graph uses X & Y controllers to allow you to scrub through 30 days along the x-axis and number of likes in the y-axis. The upward gradient also marks the average exposure increase across all shots. If you move the x-axis seeker you'll see the shots move around the graph with changing numbers and controllers to see what that point in time was like for your popularity.
This was pretty fun for testing a different colour combination as I'd never worked in beige before. Testing alternative styles is super refreshing, and it's helping me understand certain things that I don't normally get from doing some of these shots on auto-pilot mode.
@2x. Thoughts welcome.