


Data Visualisation | Drivetrain


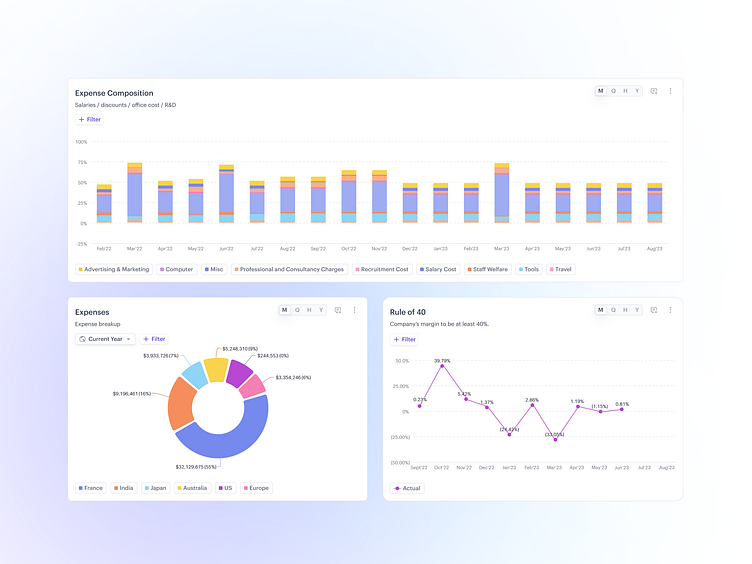
Data visualisation charts designed for a Financial Planning company.
More exciting stuff sharing soon 🥳
If you find this design appealing, don't hesitate to leave a like 👍
----------------------------------------------------------------
We are ready for new projects 🤠
Send inquiry to: 📨 42@turinglabs.in
or visit our website: 🌐 turinglabs.in