Statsig Analytics 📈


Introducing Analytics on Statsig 🎉
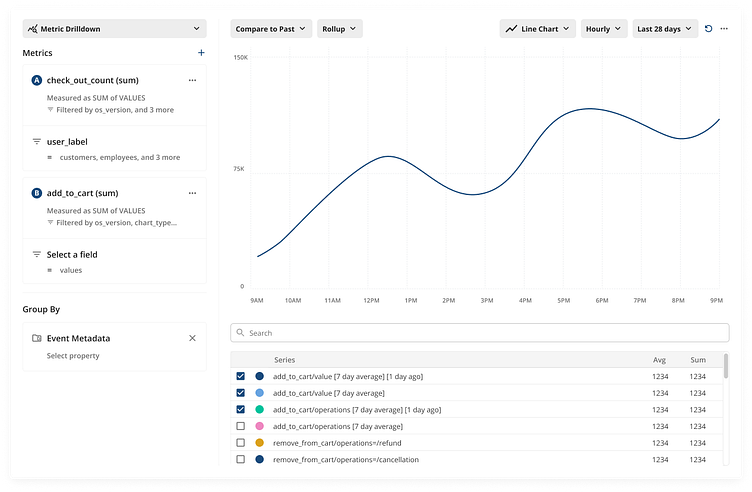
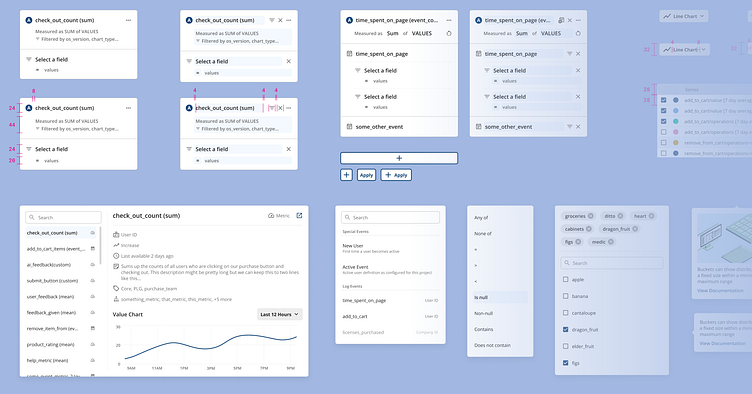
As part of ongoing efforts to enhance product observability flows on Statsig, our team is hard at work building an analytics offering where users will be able to analyze their events and metrics using various chart types, such as drilldowns, retention, funnels, and user journeys. New components were designed to fit certain analytics needs.
Go check it out on Statsig!
Tools: Figma for mocks + animation