


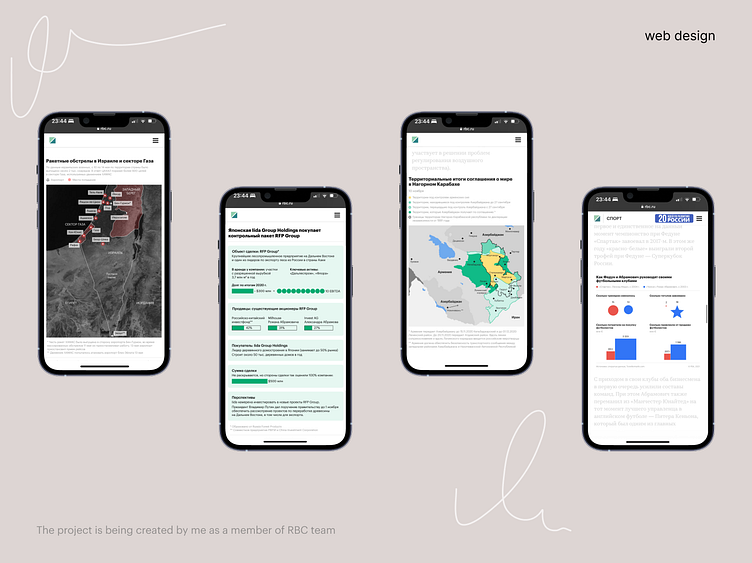
Data visualisation for the RBC Group

Situation:
— Infographics were built from scratch every time, time consuming process
— There was no consistency. Designers were working without a design system
— They were not user friendly for mobile, low user engagement rate
Solution
— Created templates with components to downsize the amount of time the team spends on creating one
— Created design system taking into account different visual styles of different sub products of the RBC group
— A number of infographics that were supposed to be upgraded from time to time were atomised, to optimise the process and downsize the engagement between authors and design team and to upgrade data much faster (up to 2 times)