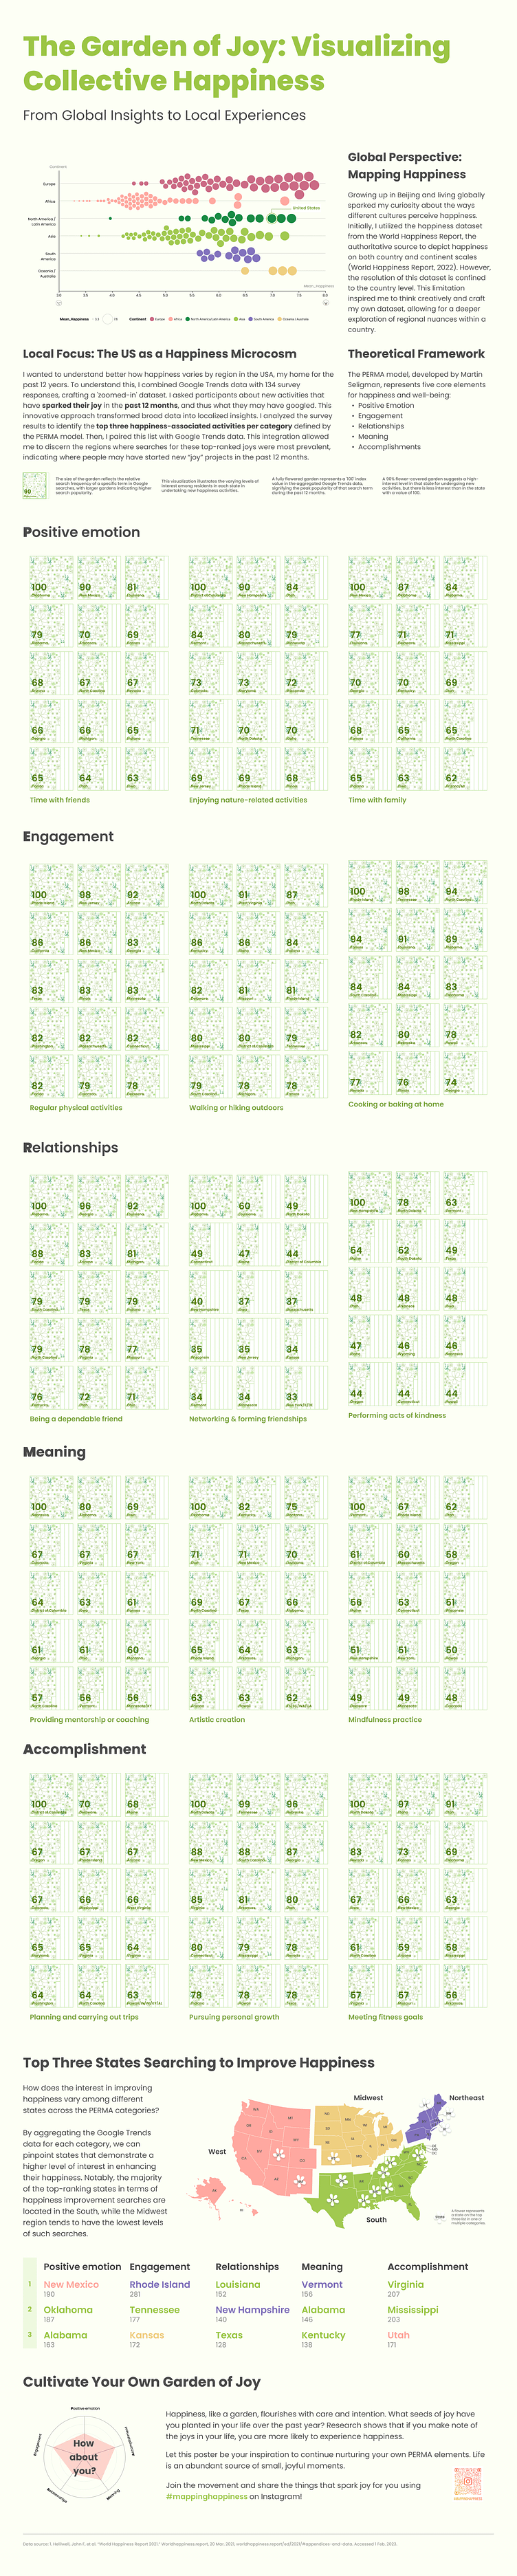
The Garden of Joy: Visualizing Collective Happiness

Global Perspective: Mapping Happiness
Happiness is a deeply personal experience, yet everyone pursues happiness. Growing up in Beijing and living across the globe sparked my curiosity about the ways different cultures perceive and live out happiness.Initially, I utilized the happiness dataset from the World Happiness Report, an annual survey on happiness, which is widely regarded as the most authoritative source of happiness. However, the dataset is confined to the country level. I wanted to understand how happiness looks at a sub-national level. This inspired me to think creatively and craft my own dataset, allowing for a deeper exploration of regional nuances within a country.
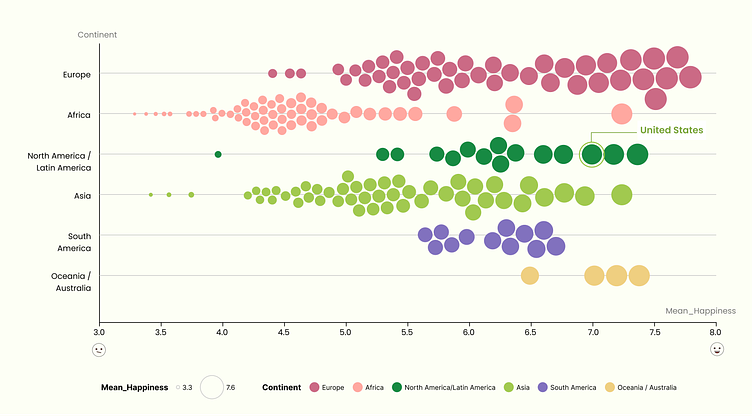
The graph above displays world happiness levels at both continental and country levels. The size of each circle represents the mean happiness value per country, with larger circles indicating higher mean happiness values. Different colors are used to distinguish countries on various continents. Most countries in Africa tend to have lower happiness levels, while countries in Europe, North America, Latin America, Oceania, and Australia generally exhibit higher happiness levels.
Local Focus: The US as a Happiness Microcosm
I selected the United States, my home for the last 12 years, for further exploration. I use the garden as a metaphor for this visualization, as I associate the outdoors and nature with happiness. It is a motif that brings joy to me. This creative approach allowed me to take the national data from the Happiness Survey and explore it with localized insights. From the survey results, I determined the top three new happiness-associated activities for each of the five P-E-R-M-A categories. Then, I paired these top 3 activities with Google Trends data (from 08/02/2022 to 08/02/2023). Leveraging this data let me see the top 15 states for each activity – meaning that these were states where residents had been the most active in searching for ways to improve their happiness in the past 12 months.
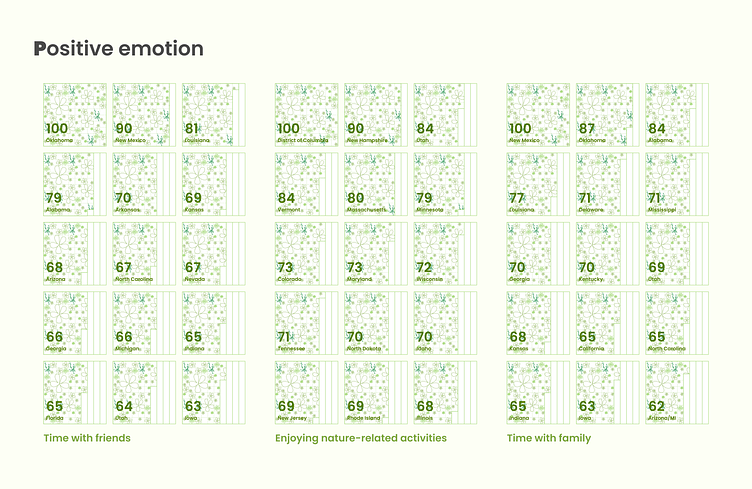


Use the first slide as an example that illustrates the top three new activities associated with positive emotions, as classified under the 'P' in the PERMA categories. Slide right to explore more categories.
Theoretical Framework
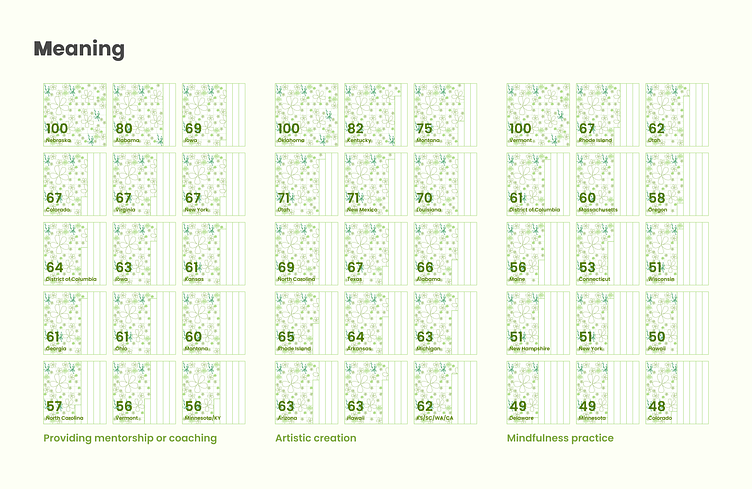
The theoretical framework for this project is from the P-E-R-M-A model, developed by Martin Seligman, which represents five core elements for happiness and well-being: Positive Emotion, Engagement, Relationships, Meaning, and Accomplishments.
P-E-R-M-A is the foundation for positive psychology, which focuses on how what makes life worth living as well as the study of how to define and quantify well-being.
To understand this at a local level, I combined Google Trends data with 134 survey responses, crafting a 'zoomed-in' dataset. Using the P-E-R-M-A model as a starting point, I conducted a survey asking participants about new activities that they undertook in the past 12 months, and thus what they may have googled. Because there is a lack of good sub-national data, leveraging Google Trends data at a state level allowed me to understand the differences in happiness across the United States. This model did rely on people engaging in new activities, as I assumed that they would not be googling for already established routines.
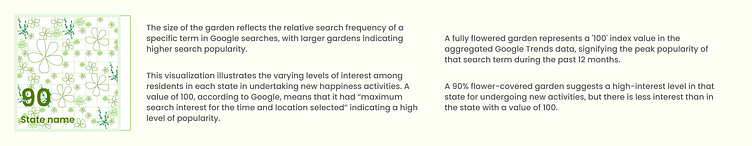
I display these results using a garden motif. The above image illustrates how to read a flower.