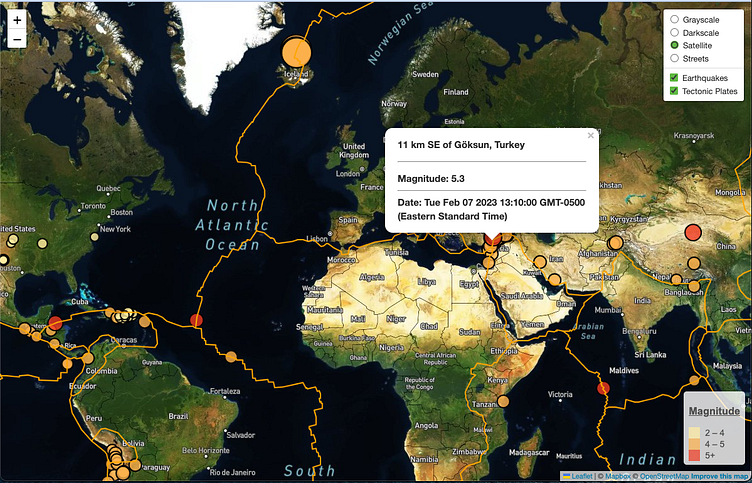
Earthquake Magnitude Map (leaflet.js)

Data visualization bootcamp homework assignment:
Make an API call and request weekly earthquake data from the United States Geological Survey (USGS)
Display the magnitude with color and size of the map marker
Include controls to change the background map layers
See the active map: https://victoryamaykin.github.io/Earthquake-Leaflet-Map/