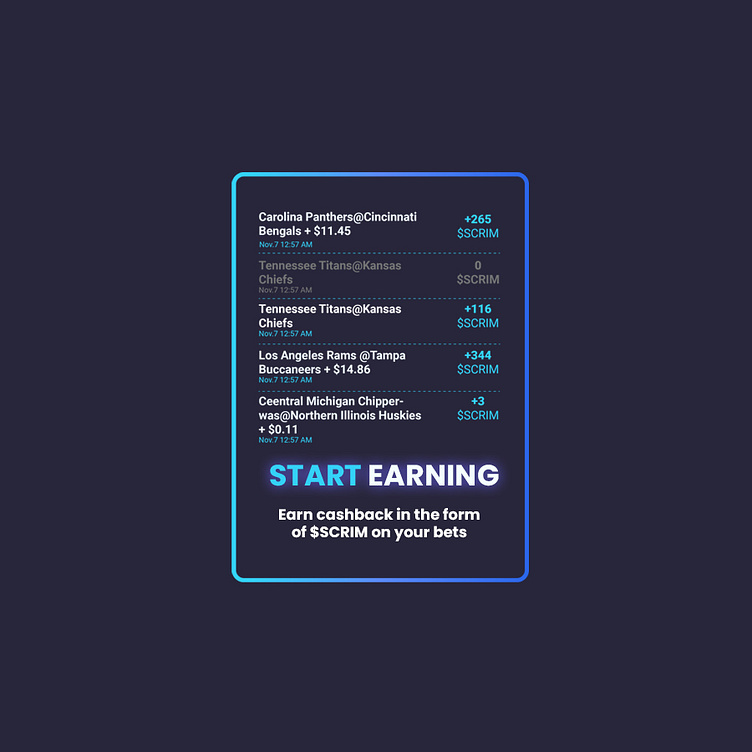
Data Visualization simple redesign

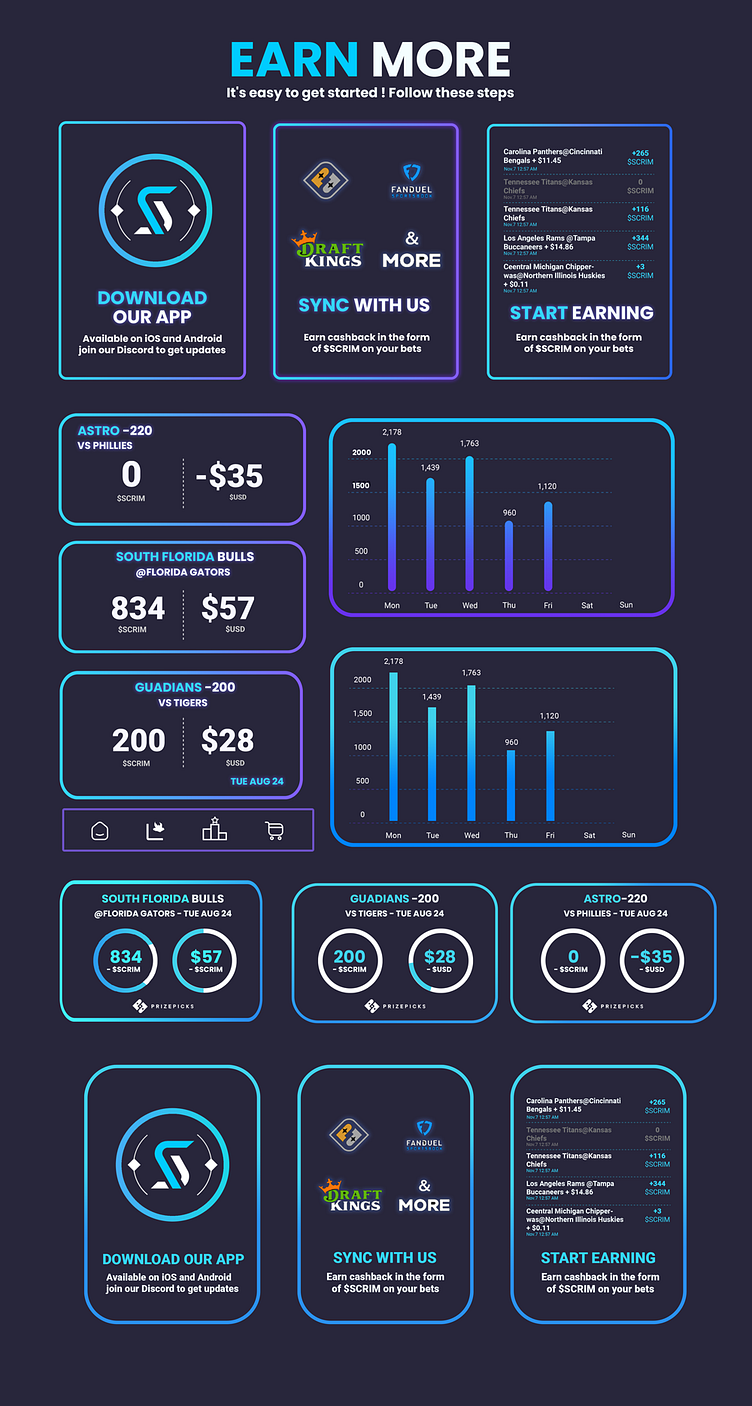
Brand colors. I used blue/green and purple as primary and secondary colors and shades.

The graphics are linear and minimalist. The shape outline has a gradient. Gradient colors include the brand's primary colors. The names and some elements of the text are highlighted.