Affinity Diagram for web app

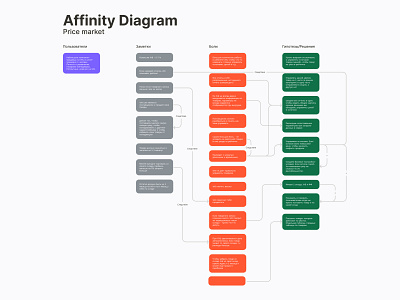
This Diagram is useful when there is a lot of disparate information, such as after a series of interviews. It helps to structure data, distribute the received information into semantic groups, find pain points and formulate hypotheses.
💼 Project: Price market — web app for Wildberries
👾 My role: Product designer