Trends


Upcoming feature. Using data from all the colors selected, we are going to create these visualizations of the most popular colors, for each month.
Logic
Using the HSL model, we will select X ranges from the 360 hues. 360/X = Y hues per range.
We convert all colors to the HSL model and classify them using their hue on each of these ranges.
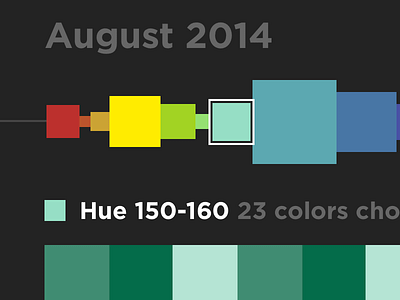
We mix all colors on each range to come up with the representative color for each month
Ranges are presented horizontally. The size represents how many colors were selected on each range.
Clicking on a range shows all the colors selected for that range.