todo.vu Project Management


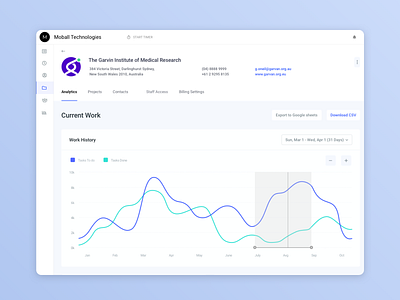
This screen shows the progress of completed tasks and those that have not been completed yet. 😊
_
About the project: @todo.vu_
Design by: @bumble_bee_11
_
On this graph, we can filter a certain period that interests us and see the ratio of completed tasks and those that need to be done. Also the data can be exported to google sheets or csv for further processing 🤟