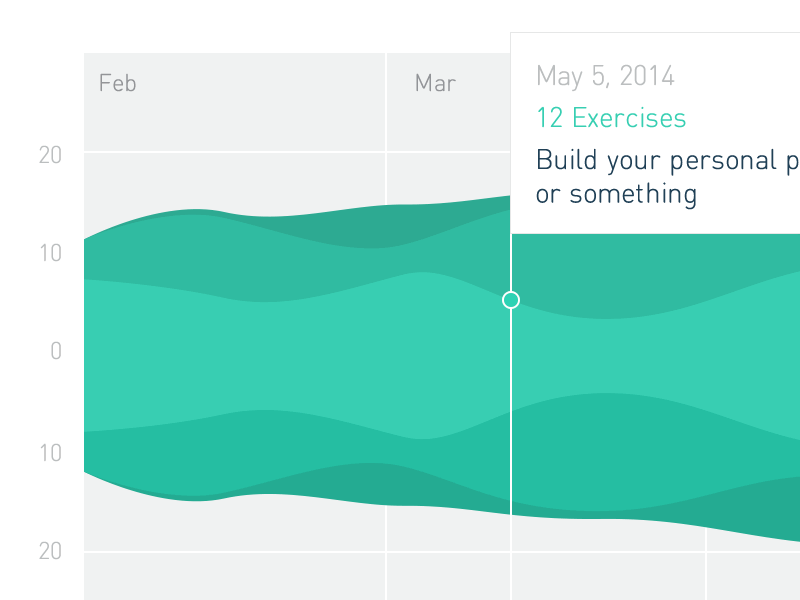
History Chart
A bit of data visualization juice to map user engagement with our platform - How many exercises/tracks have you completed over time?
View all tags
Posted on
Feb 26, 2014
More by Codecademy View profile
Like


