Unemployment Rate Line Graph

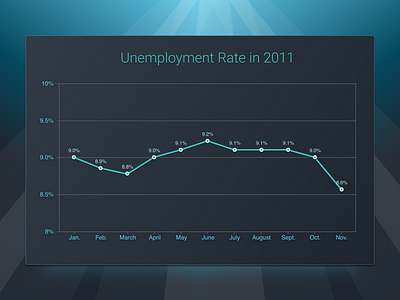
Applying a dark theme with blue and teal chart lines. Applied an water like background to fit with the color scheme.
This shot was created utilizing Chart System Pro, a complete chart and graph design system for Figma covering all grid-based chart types including line, bar, area, bubble, scatter plot, spline, and candlestick. Utilize prebuilt templates to get a jump start on building out your graphs and swap out component styles with speed and ease. Chart System Pro will easily integrate into your other UI design systems and save you weeks of work.
Product Launch Pricing: $9.99