


Dashboard Design- Atlantis

Dashboard Design - Atlantis.
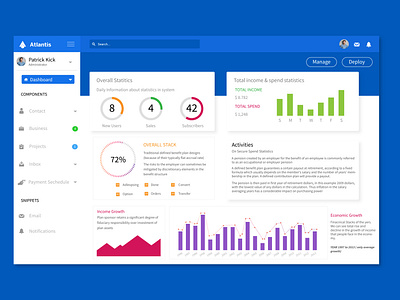
A data dashboard is an information management tool that visually tracks, analyzes and displays key performance indicators (KPI), metrics and key data points to monitor the income of a business, department or specific process.
They are customizable to meet the specific needs of a department and company. Behind the scenes, a dashboard connects to your files, attachments, services, but on the surface displays all this data in the form of tables, line charts, bar charts and gauges.
A data dashboard is the most efficient way to track multiple data sources because it provides a central location for businesses to monitor and analyze performance. Real-time monitoring reduces the hours of analyzing and long line of communication that previously challenged businesses.
================================
Fonts Used: Source Sans Variable
Font Styles: Regular, Italics and Bold
================================
Tools Used: Adobe Illustrator, Adobe XD
=================================
Colours Used:
#1572E8 - R:21, G:114, B:232 || #0059BA
R:0, G:89, B:186 || #D4145A - R:212,G:20, B:90