Procon: Overview Injuries Dashboard


Hello guys, Whazzup!
Did you know that 2.3 million people around the world succumb to work-related accidents or diseases every year; this corresponds to over 6000 deaths every single day. Worldwide, there are around 340 million occupational accidents and 160 million victims of work-related illnesses annually 😮 (ref: https://www.ilo.org/moscow/areas-of-work/occupational-safety-and-health/WCMS_249278/lang--en/index.htm)
The construction industry has the highest rate of recorded accidents. There is currently no standard tool on how-to report those injuries within the industry. Ooh yeah - we feel pumped to work on this problem-solving challenge 💪 🤓
The SaaS application we are building here will solve this challenge soon. In fact it should be pushed by government to the whole construction industry to report the injuries. If we get all the data in a consistent way from the whole market we can use machine learning to identify trends of injuries and identify the reason of those injuries and as a final goal - we can potentially save lives or chronicle injuries! 👨💻 🚀
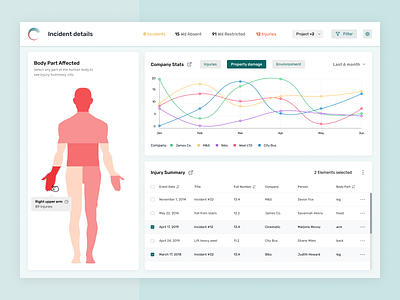
Today we present you the screen where a construction company can select his projects and can get an overview of all the injuries that are reported. On the top bar he can see the most important statistics and the user can use advanced filters to narrow down the data. On the left you see an interactive illustration of the most important filter - the body parts. A rollover gives quickly the data of the injuries on that part and a click on the body part will activate the particular filter.
Let us know what you think about it!
-> Drop us a line at ux@jouret-development.com
-> -> Delight us with your love! Press "L".
Visit our website for some case studies!
Want to see more projects? Visit our profile and remember to follow us!