Find designers
Designer search
Quickly find your next designer
Post a job
The #1 job board for design talent
Inspiration
Courses
UX Diploma
Learn UX design from scratch in 6 months
UI Certificate
12-week UI skill building for designers
Live interactive workshops
with design professionals
Jobs
Go Pro
Log in
Dribbble: the community for graphic design
Log in
Sign up
David Bitton
UI / Visual Design, Product Design, UX Design / Research
Get in touch
Follow
Following
Blocked
Work
Collections
Liked Shots
About
Recent Shots
Recent Shots
Popular Shots
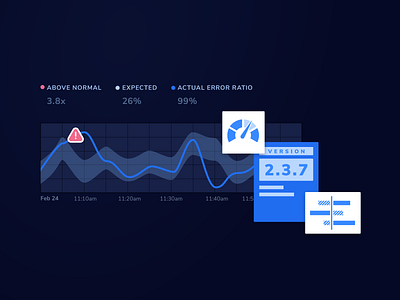
View Machine Learning Reports
Machine Learning Reports
Like
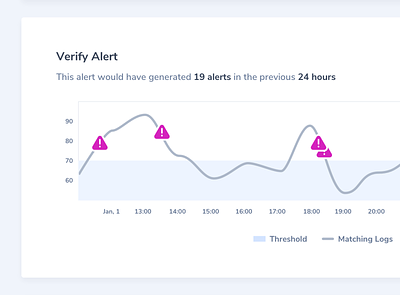
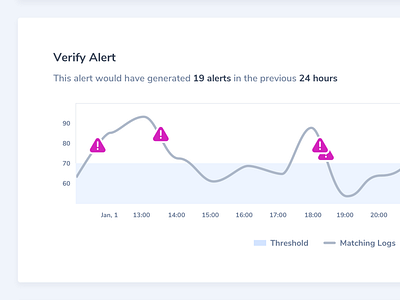
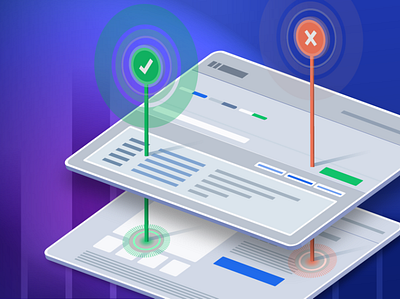
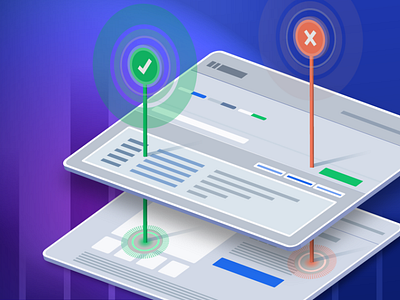
View Verify Alert
Verify Alert
Like
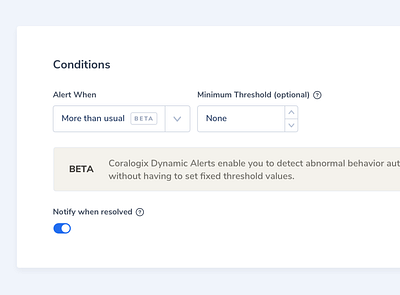
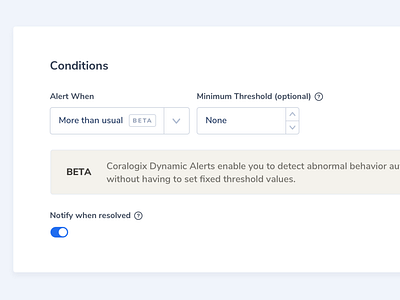
View Beta
Beta
Like
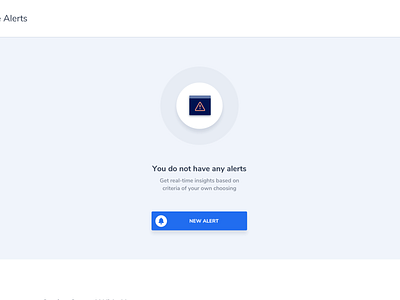
View Empty Alert Screen
Empty Alert Screen
Like
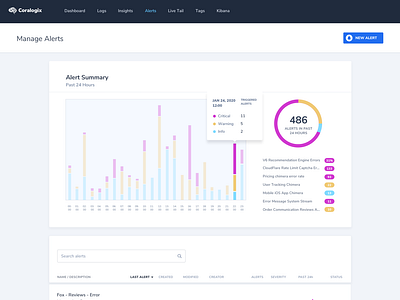
View Alerts List Interface
Alerts List Interface
Like
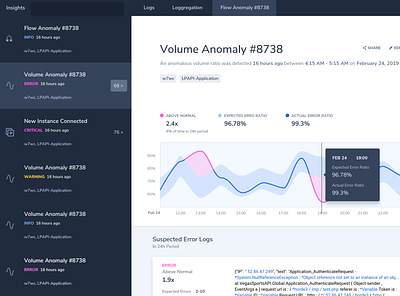
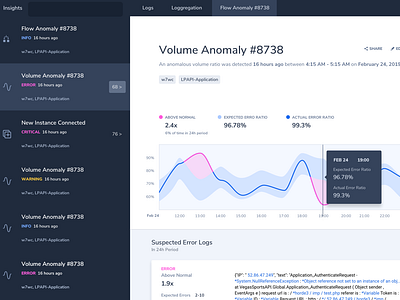
View Anomalies
Anomalies
Like
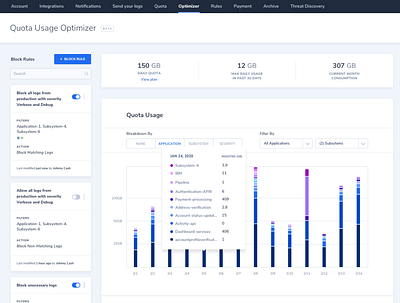
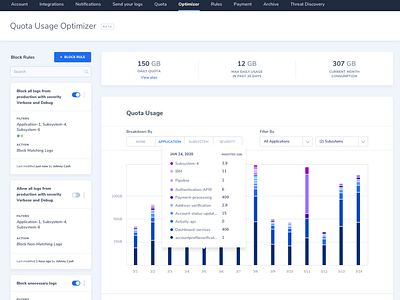
View Data Usage Optimizer Tool
Data Usage Optimizer Tool
Like
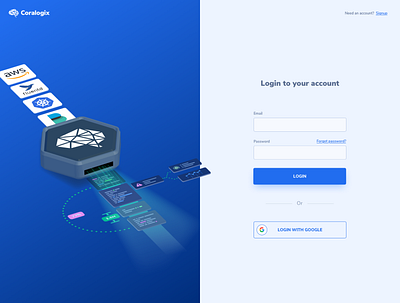
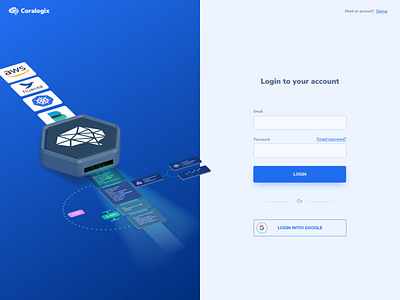
View User Login Screen
User Login Screen
Like
View App Monitoring Illustration for SaaS
App Monitoring Illustration for SaaS
Like
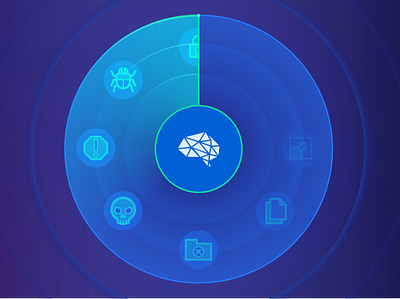
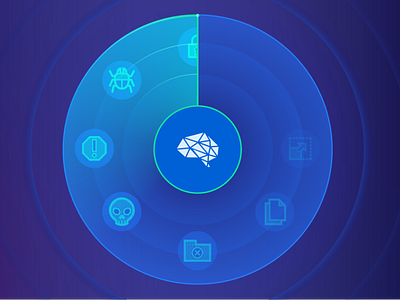
View Radar Illustration for SaaS Product
Radar Illustration for SaaS Product
Like
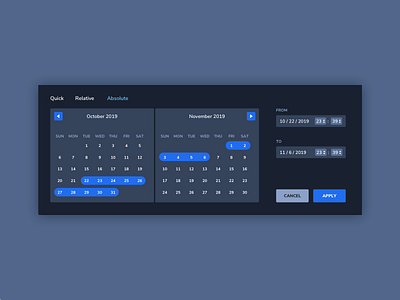
View Datepicker
Datepicker
Like
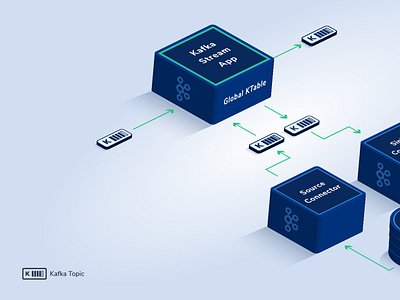
View Kafka Cloud Technical Diagram
Kafka Cloud Technical Diagram
Like
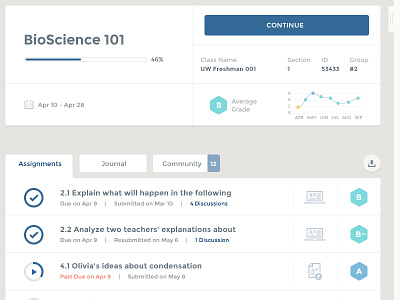
View Online Learning
Online Learning
Like
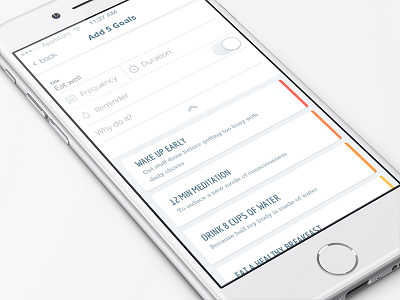
View Self Development App
Self Development App
Like
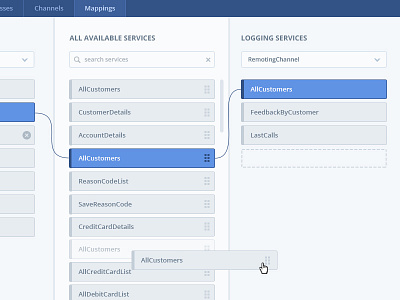
View Visual App Builder
Visual App Builder
Like
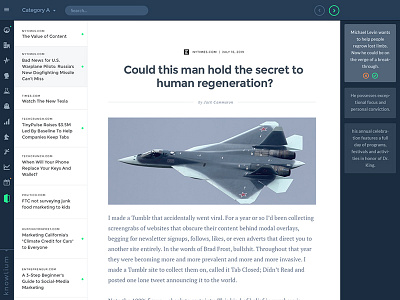
View Research Feed
Research Feed
Like
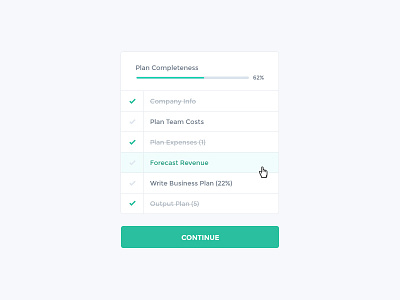
View Getting Started Tasks
Getting Started Tasks
Like
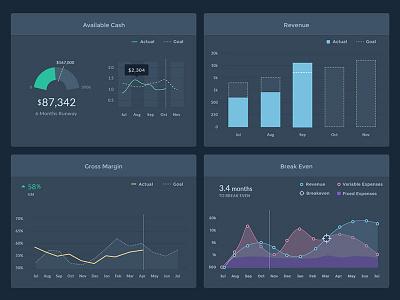
View Financial Dashboard
Financial Dashboard
Like
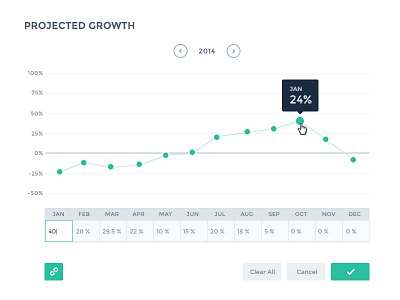
View Projected Growth
Projected Growth
Like
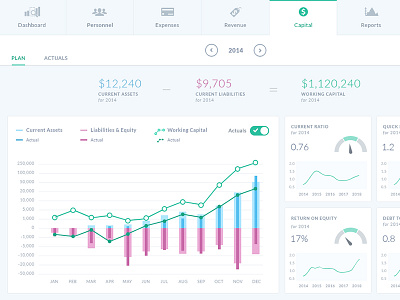
View Business Plan Software
Business Plan Software
Like
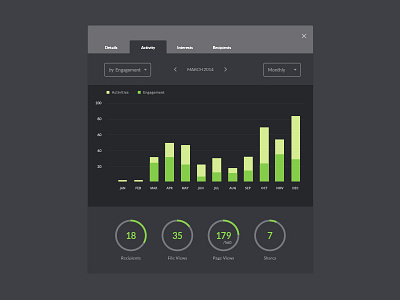
View Activity Overview Chart
Activity Overview Chart
Like
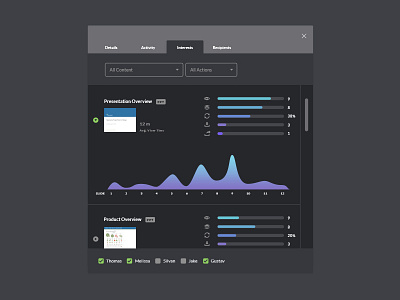
View Detailed File Report
Detailed File Report
Like
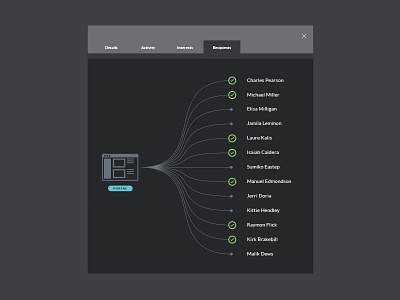
View Cluster Dendrogram Graph
Cluster Dendrogram Graph
Like
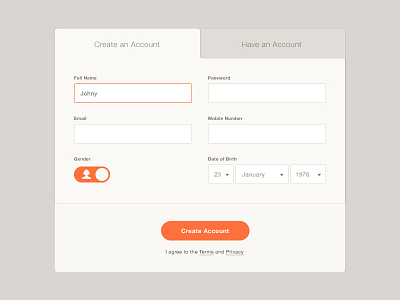
View Registration form
Registration form
Like
← Prev
Next →
Sign up to continue
Loading more…
Available for new projects
Get in touch
Previous
Next
Loading…
Loading…