Taxes complete

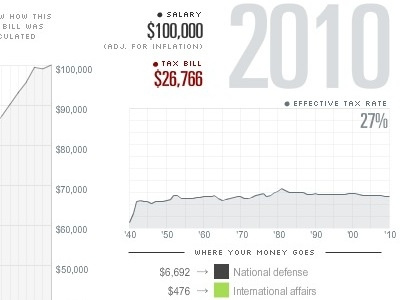
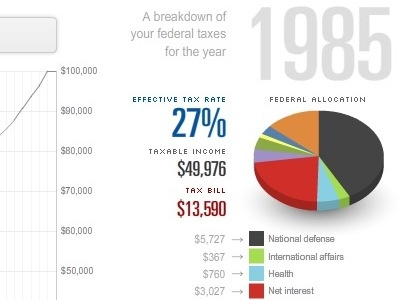
The taxes piece has finally published. We ended up with a sparkline of the tax rate in lieu of the pie chart as the stacked time series chart on the graph addresses the budget's breakdown.
I kind of don't feel like doing my taxes this year now, since I basically just did everyone's for the past 70 years.