Team performance reporting – Email analysis

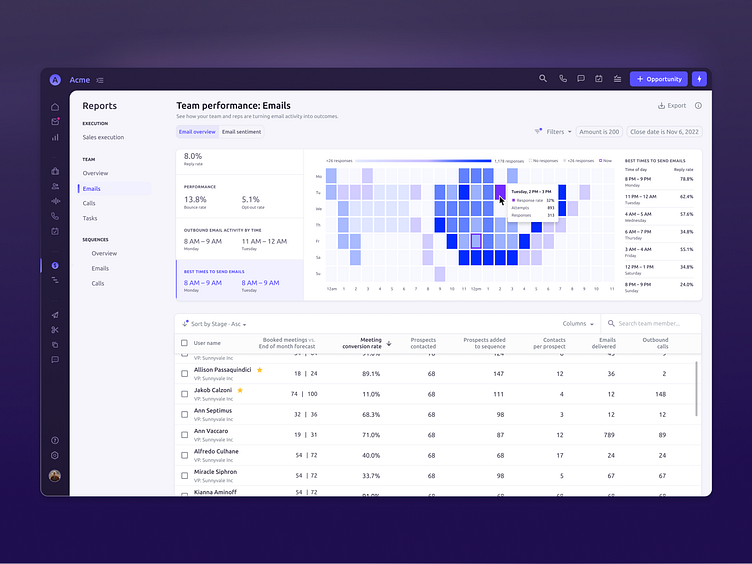
In sales, the right timing is crucial, especially in prospecting phase. Identifying the optimal moment to engage your prospect through email is a key. In my exploration, I utilized a heatmap to provide insights about the best time to send an email during the selected period.
Here are a few tips: Visualizations are fantastic, but if you can convey the key insights simply, go for it. If there is a user need to delve deeper, correlate data, compare periods, and uncover additional insights, that's when rich visualizations become valuable. Also, ensure that the color palette used is accessible.
Some good stuff to read
The Visual Display of Quantitative Information by Edward R. Tufte
How Charts Lie: Getting Smarter about Visual Information
by Alberto Cairo


