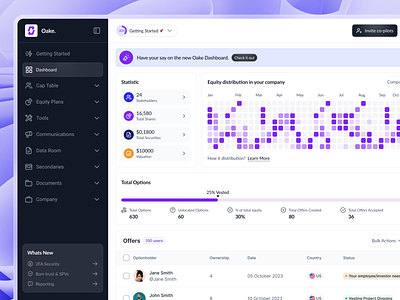
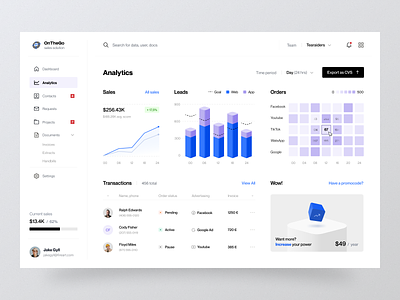
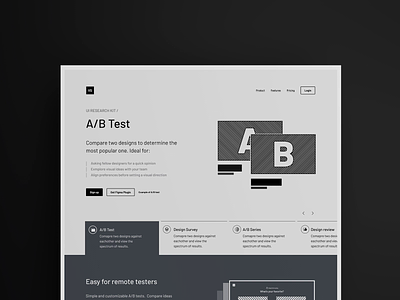
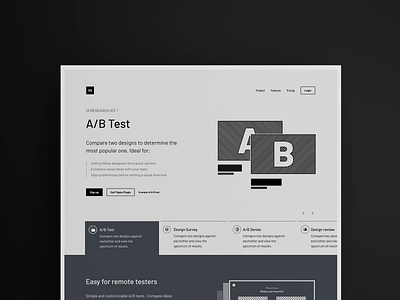
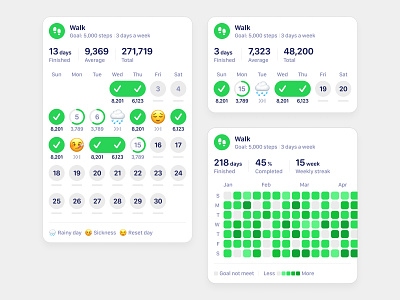
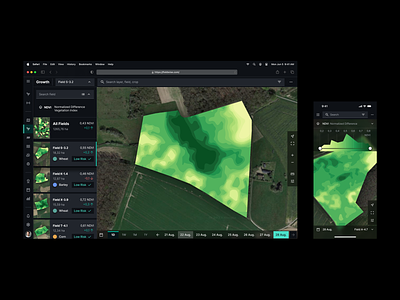
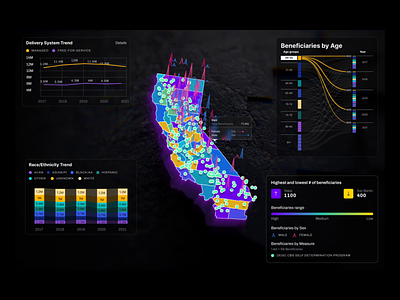
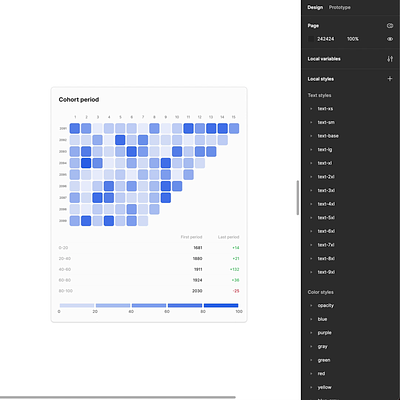
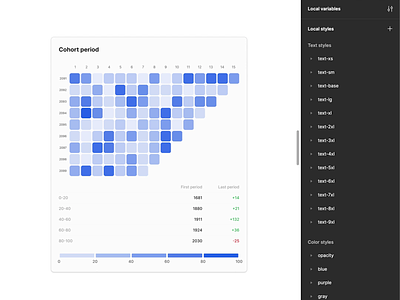
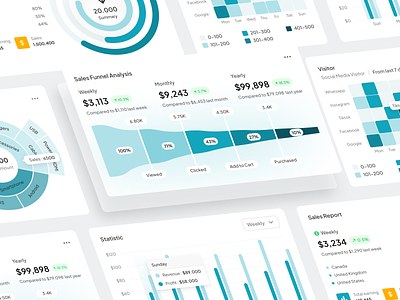
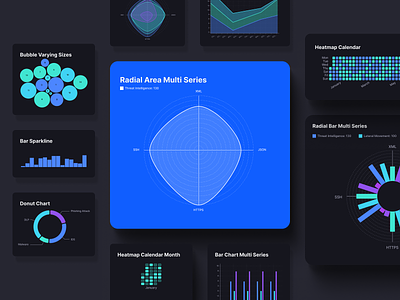
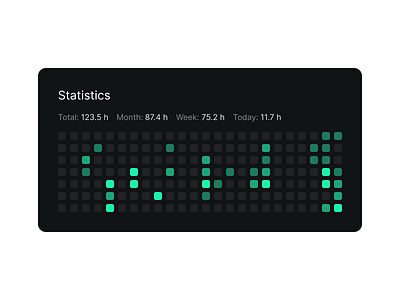
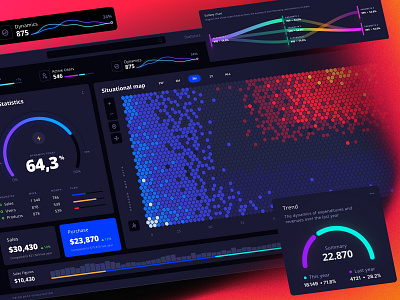
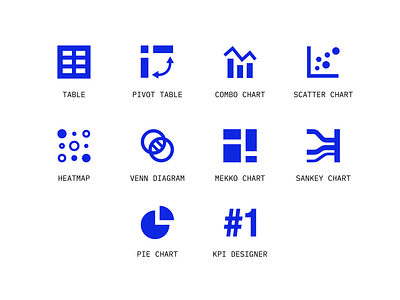
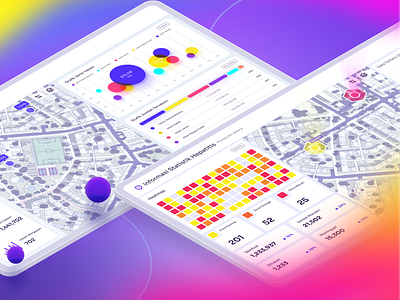
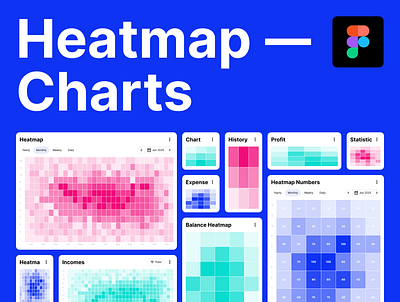
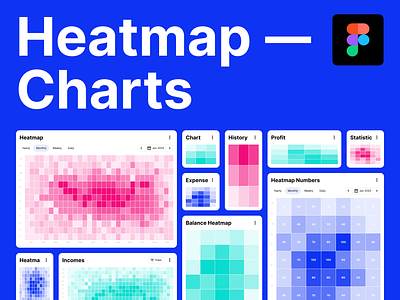
Heatmap

299 inspirational designs, illustrations, and graphic elements from the world’s best designers.
Want more inspiration? Browse our search results...

  1. What Are Heatmaps, and How Can I Use Them in my Marketing? blue collage collage maker collageart digital art heatmap illustration map orange paper art papercut ripped ripped paper texture
    View What Are Heatmaps, and How Can I Use Them in my Marketing?
    What Are Heatmaps, and How Can I Use Them in my Marketing?
    45
    16k
  2. Earthquake Dashboard Statistic - Spatial UI Design analytic chart clean danger dashboard design earthquake heatmap location map ui ux web design website
    View Earthquake Dashboard Statistic - Spatial UI Design
    Earthquake Dashboard Statistic - Spatial UI Design
    208
    25.8k
  3. Spider diagram vs. heat map content marketing platform data data visualization design heat heatmap hot map passion spider diagram spidermap ui ui design
    View Spider diagram vs. heat map
    Spider diagram vs. heat map
    140
    77.4k
  4. Data visualization app UI-kit | Heatmap app charts data viz design system heatmap ui ui kit ux
    View Data visualization app UI-kit | Heatmap
    Data visualization app UI-kit | Heatmap
    11
    5.8k
  5. SAAS - Dashboard Equity plans b2b chart clean crm dashboard design equity equity plans heatmap interface minimal plans product design saas software software as a services ui ux
    1
    View SAAS - Dashboard Equity plans
    SAAS - Dashboard Equity plans
    214
    16.2k
  6. Sales Dashboard | Analytics | Web App admin panel analytics banner blue cards chart dashboard fireart fireart studio graph heatmap layout premium saas sales sidebar software system table web app
    View Sales Dashboard | Analytics | Web App
    Sales Dashboard | Analytics | Web App
    1.2k
    559k
  7. Getting ready for FlutterFlow Wrapped dashboard ff wrapped flutter flutterflow graph heatmap spotify wrapped user chart wrapped year in review
    View Getting ready for FlutterFlow Wrapped
    Getting ready for FlutterFlow Wrapped
    20
    9k
  8. Get Busy Living bones custom death design for sale graphic design heatmap life living logo skull vector
    View Get Busy Living
    Get Busy Living
    4
    1.1k
  9. Design VS Design Landing Pages 3d animation black branding c4d case study compare creative dark heatmap homepage logo minimal motion redesign report research simple test ui
    View Design VS Design Landing Pages
    Design VS Design Landing Pages
    81
    37.8k
  10. Weekly / Monthly / Yearly annualy chart chart design charts column chart data data visualization graphic design habits habits app heatmap monthly streak to do weekly yearly
    View Weekly / Monthly / Yearly
    Weekly / Monthly / Yearly
    119
    24k
  11. Real-time Biomass Monitoring on Mobile and Desktop agriculture biomass carbon crop dark design design system desktop digital field heatmap ibm map precision agriculture responsive ui ui design ux ux design vra
    4
    View Real-time Biomass Monitoring on Mobile and Desktop
    Real-time Biomass Monitoring on Mobile and Desktop
    7
    2.6k
  12. DHCS - Healthcare Data Visualization Map dashboard design data infographic data map ui data vizualization database user interface earth earth illustration graphic design heat map data heatmap interface for healthcare location interface map design map visualization map visualization interface nterface for healthcare public healthcare uiux visual design
    View DHCS - Healthcare Data Visualization Map
    DHCS - Healthcare Data Visualization Map
    177
    38.3k
  13. Adaptable Heatmap Chart Component in Figma auto layout charts dark mode design design system designer figma heatmap interface layout wrap mobile product design responsive ui ui elements ui kit ux ux design variables web design
    View Adaptable Heatmap Chart Component in Figma
    Adaptable Heatmap Chart Component in Figma
    30
    3.6k
  14. Performanza - Sales Analytics Component System analytics bar chart chart component component component system data visualization design system funnel chart heatmap pie chart saas saas component sales sales amount sales analytics sales component sales funnel sales monitoring sales report statistic
    1
    View Performanza - Sales Analytics Component System
    Performanza - Sales Analytics Component System
    94
    8.7k
  15. Unify Viz - 300+ Data Visualizations for Figma and React area bar branding charts clean dashboard data visualization dataviz design figma heatmap line radial simple ui ux
    View Unify Viz - 300+ Data Visualizations for Figma and React
    Unify Viz - 300+ Data Visualizations for Figma and React
    4
    1.3k
  16. Heatmap heatmap statistics ui widget
    View Heatmap
    Heatmap
    9
    2.2k
  17. Lottery 3d animation arnold dynamics heatmap mash maya mograph motion
    View Lottery
    Lottery
    103
    21.2k
  18. BLOG - Modernising Transport astrato blog header charts data dataviz freight heatmap illustration industry lorry manufacture michael waite mike waite shipping transport transportation visualization vizlib
    View BLOG - Modernising Transport
    BLOG - Modernising Transport
    7
    2.2k
  19. Orion UI kit – Temperature map and widgets ai animation app chart dashboard dataviz design desktop heatmap hex hexagon infographic pie chart saas sankey service statistic template ui widgets
    View Orion UI kit – Temperature map and widgets
    Orion UI kit – Temperature map and widgets
    37
    12k
  20. Block Heatmap 3d character design choropleth data visualization depth of field heatmap infographic map motion design motion graphics tilt shift
    View Block Heatmap
    Block Heatmap
    100
    46.3k
  21. New Chart Icons astrato chart design chart icons combo chart data data icons heatmap icon icon design icons kpi designer mekko chart mike waite pie chart pivot table sankey chart scatter chart venn diagram vizlib
    View New Chart Icons
    New Chart Icons
    9
    2.8k
  22. Health Dashboard, Heatmap, Infographic app care covid dinas dropdown gis health heatmap hospital indonesia infographic map maps modern peta sars ui
    View Health Dashboard, Heatmap, Infographic
    Health Dashboard, Heatmap, Infographic
    3
    1.8k
  23. SalesPulse - Sales Analytics Dashboard analytics analytics dashboard chart dashboard dipa inhouse interface minimal product product design sales analytics dashboard sales funnel ui ui design web app webapp
    View SalesPulse - Sales Analytics Dashboard
    SalesPulse - Sales Analytics Dashboard
    190
    24.9k
  24. Heatmap Data Visualization - Master Chart admin panel chart design charts color dashboard data design figma graph heatmap heatmap charts layout mobile design pattern product saas system table visualization web app
    1
    View Heatmap Data Visualization - Master Chart
    Heatmap Data Visualization - Master Chart
    3
    1.8k
Loading more…