Find designers
Designer search
Quickly find your next designer
Post a job
The #1 job board for design talent
Inspiration
Courses
UX Diploma
Learn UX design from scratch in 6 months
UI Certificate
12-week UI skill building for designers
Live interactive workshops
with design professionals
Jobs
Go Pro
Log in
Dribbble: the community for graphic design
Advance your career with a Professional Diploma in UX Design
Learn more
Log in
Sign up
Sales Statistics Report
Inspirational designs, illustrations, and graphic elements from the world’s best designers.
Want more inspiration? Browse our
search results
...
Shot Link
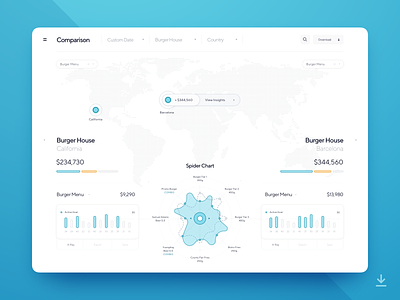
View Dashboard Spider Chart - Location Comparison SET 02-1
Dashboard Spider Chart - Location Comparison SET 02-1
Like
Dtail Studio
Team
Like
716
320k
Shot Link
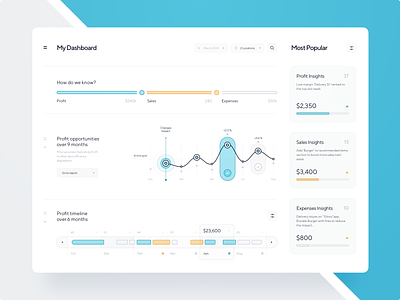
View Dashboard View - SET 01-2
Dashboard View - SET 01-2
Like
Dtail Studio
Team
Like
1.2k
392k
1
Shot Link
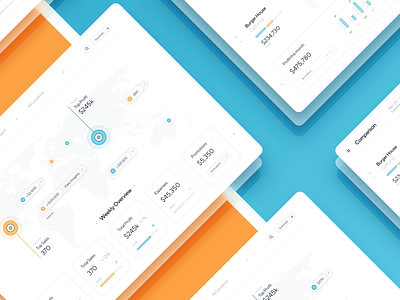
View Location Analytics & Comparison SET 02
Location Analytics & Comparison SET 02
Like
Dtail Studio
Team
Like
625
347k
Sign up to continue
Loading more…
Previous
Next
Loading…