THE WAY OF DATA VISUALIZATION

THE WAY OF DATA VISUALIZATION
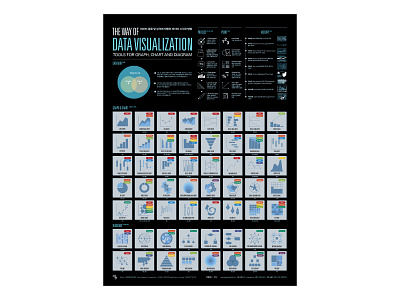
Tools for graph, chart, and diagram
StreetH_2018.05_Vol.108
-
Nowadays, it is often seen that various data are expressed visually.
Charts, graphs and diagrams are often visible.
At first glance, they look like same, but in fact they are not.
There is a visualization method to match the type and characteristic of the data.
All of the infographic about data visualization.
요즘 각종 데이터를 시각적으로 표현되는 것을 자주 볼 수 있다.
차트, 그래프, 다이어그램 등이 자주 눈에 띈다.
언뜻 보기엔 다 거기서 거기 같은 도표로 보이지만 사실은 그렇지 않다.
데이터의 종류와 성격에 맞는 데이터 시각화 방법은 따로 있다.
인포그래픽으로 정리한 데이터 시각화의 모든 것.