Instagram Evolution

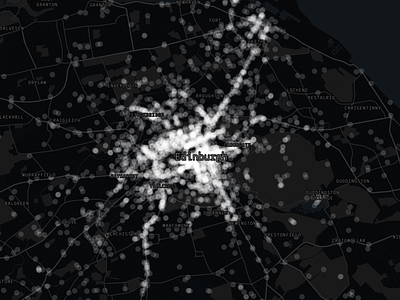
The interactive map shows the geographical distribution of Instagram posts with #Edinburgh during the last year.
The project analyze the quantitative evolution of the interaction with the social media during the last 3 years (2016-2018), comparing the changes and analyzing the spatial relationship with the points of interest of the city.
The map was developed using Grasshopper for the data processing and Mapbox.gl.js for the data visualization. Mapbox Studio was used for the style customization (streets colors, labels, icons, etc.).
For further details: info@deepmoire.com