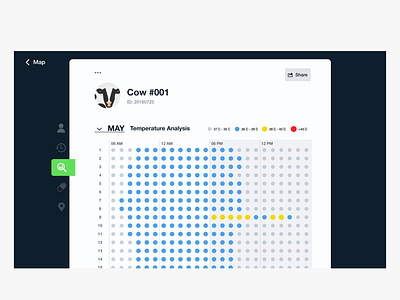
Instead of using line graph, dot matrix chart can provide quick overview on the distribution on data.