


Dailyui 018 Analytics Chart

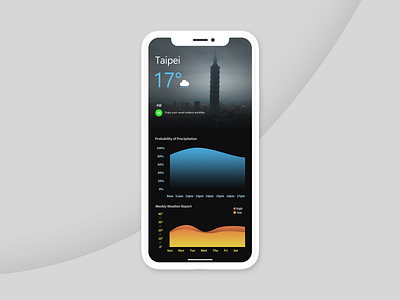

This is analytics chart for the weather report.
It's easy for people to see with graphic than the text and somebody just want to know the approximate temperature.
The color may change when the weather is sunny.
This is analytics chart for the weather report.
It's easy for people to see with graphic than the text and somebody just want to know the approximate temperature.
The color may change when the weather is sunny.