daily UI #018

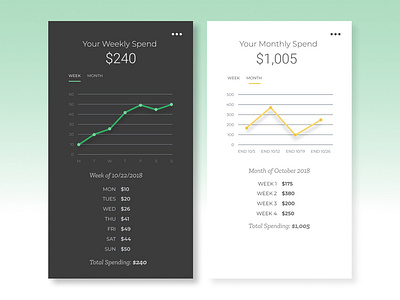
This UI is for an analytics chart, displaying a user's spending.
The month version is split into weeks. It may also be useful to show daily data points for the month screen. This would allow users to observe which day of the week they spend the most and least.
typeface: Montserrat, Zilla Slab