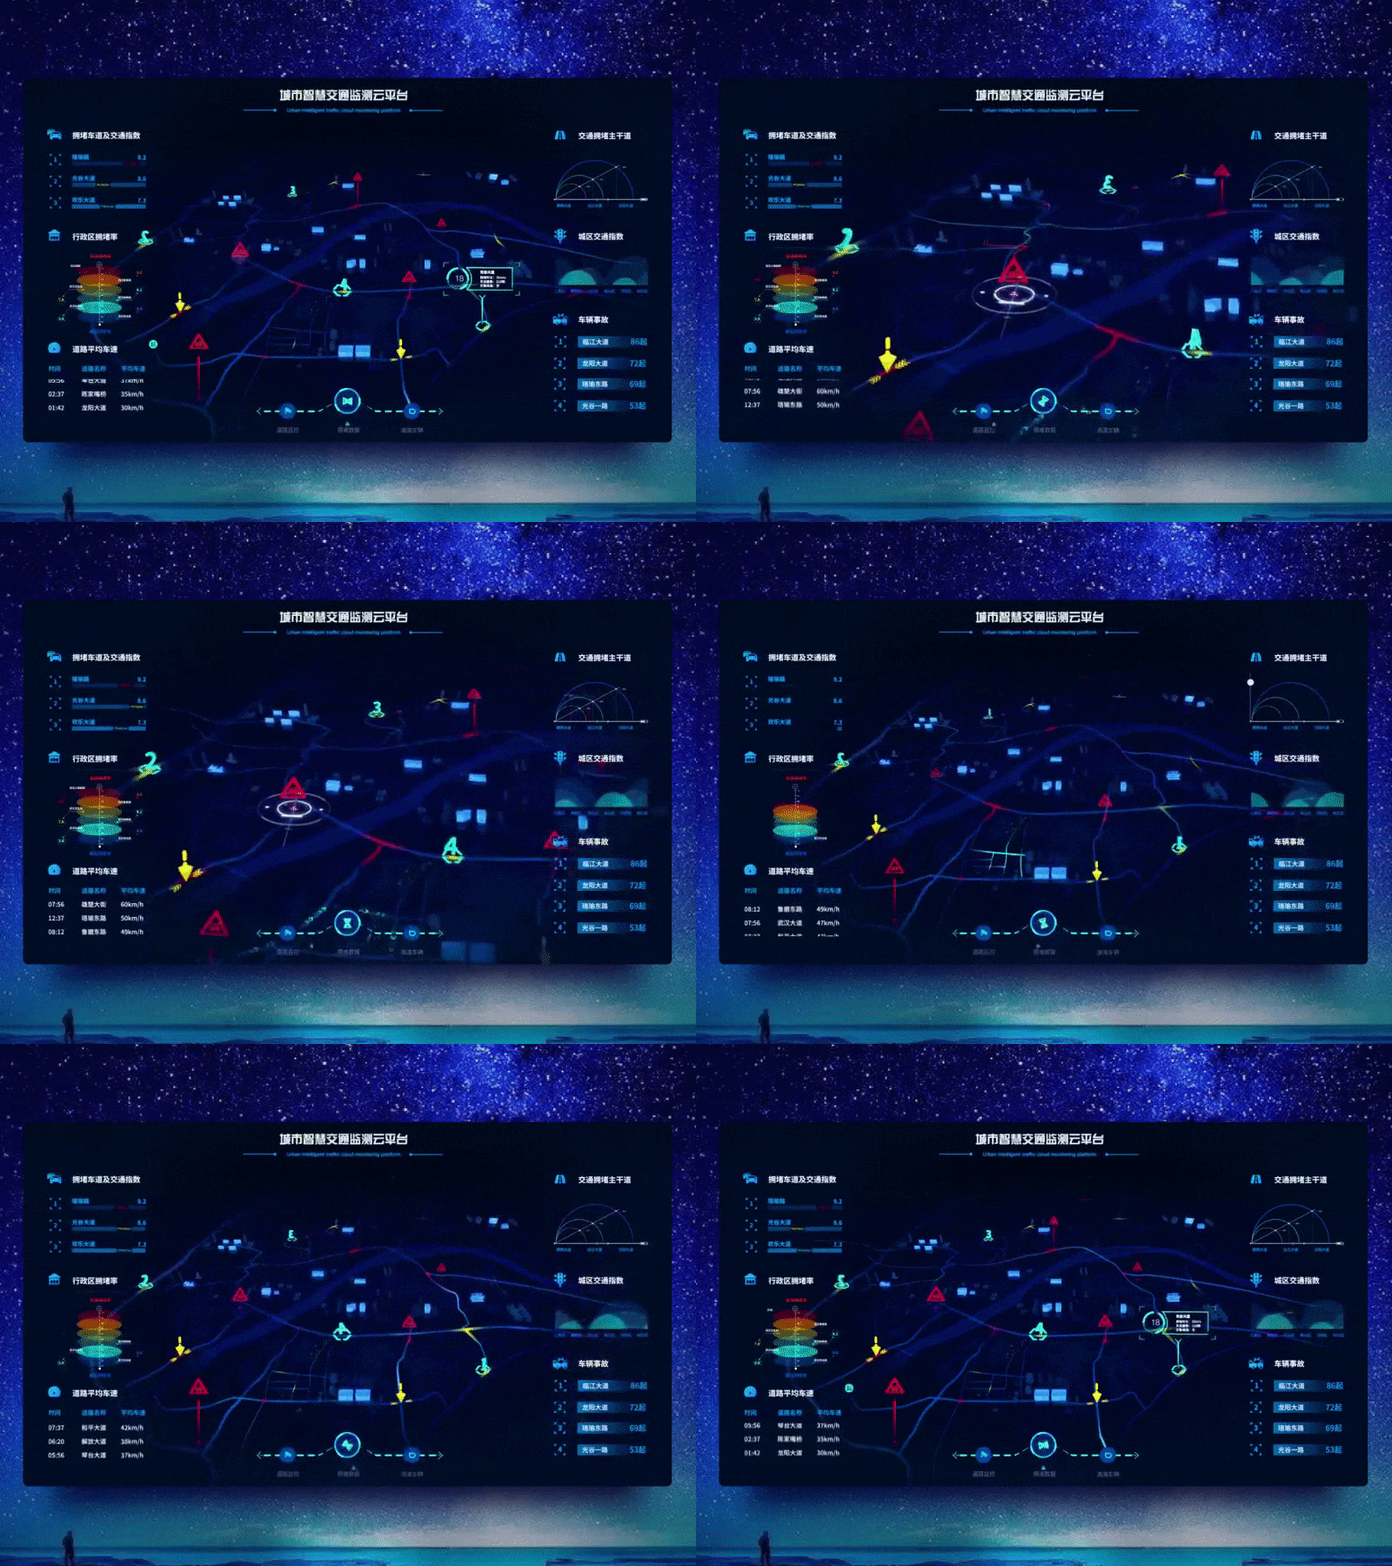
Smart Traffic Visualization 1
This is a set of urban intelligent transportation solutions. The large screen on this page mainly monitors road congestion, accident rates, administrative congestion rates and average road speeds.
-
The data cluster cleans, transforms, and maps the data into recognizable graphics animations.
-
The combination of 3D modeling and animation allows users to interact and analyze through data visualization.
-
I am focusing on data visualization design
Follow me to see more ✌️.
smart_traffic_visualization-1.mp4
8 MB
View all tags
Posted on
Oct 17, 2018
More by RED View profile
Like


