


Data visualisation line graph


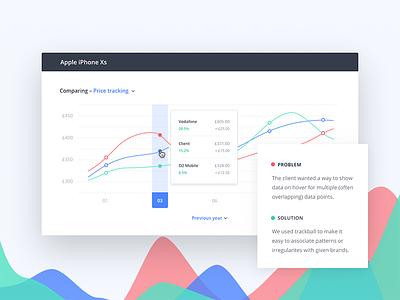
This client for this market research dashboard wanted a way to show data on hover for multiple data points. Their current setup made them hover over every single point, which made it difficult to scan the data efficiently.
Our solution was to use a trackball feature which allowed all the data points to be in an overlay which could be easily read and compared. 💫