


Report graphic

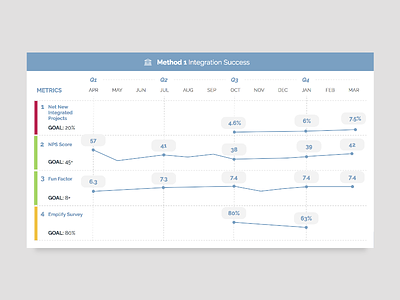

Year long read-out of metrics condensed into a google slide. One of the many fun tasks of being a corporate designer :) This was a fun challenge for data visualization practice.
Year long read-out of metrics condensed into a google slide. One of the many fun tasks of being a corporate designer :) This was a fun challenge for data visualization practice.