33 Violin Plot

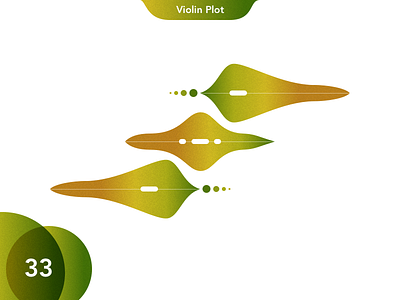
A violin plot is a method of plotting numeric data. It is similar to box plot with a rotated kernel density plot on each side. The violin plot is similar to box plots, except that they also show the probability density of the data at different values (in the simplest case this could be a histogram).