Element – Worry


A large aspect of Myndplan is helping users understand how their results compare to other users. Percentile graphs are often hard to understand, and even more often, just look terrible.
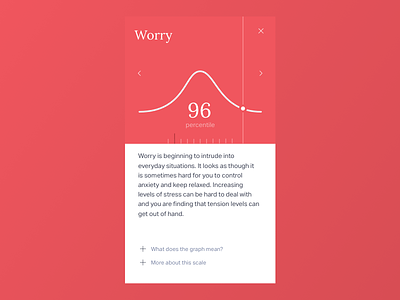
This screen shows a single (one of 20-30) elements that make up the results of our questionnaire. A detailed result with a tailored narrative specific to an individual 'psychological trait'