


Population Infographic

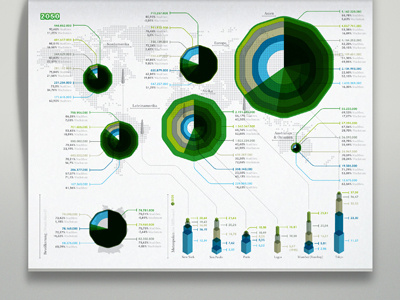
Another Infographic for the encyclopedia I'm working on. The graphic shows the evolution of the world population from 1950 to 2050. There is a transparent page (and color) for each 20-year period. This picture shows all 6 transparent pages overlapping each other. Can't wait to see/show pictures of the real printed book ...