I love infographics part 2

I love infographics part 2
Ever since my graduation back in 2012 I've been creating infographics on a regular basis, and I'm always looking to experiment with patterns and styles.
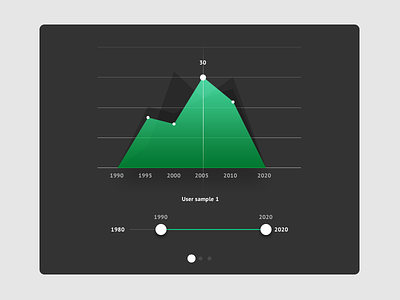
In this part, I've made an interactive line graph. The user can choose to increase or decrease the x-axis by dragging below. This way, more holistic views and more detailed views of the data can be explored.
Tell me what you think, or what kind of infographic you would like to see next!