


BCI Infograph

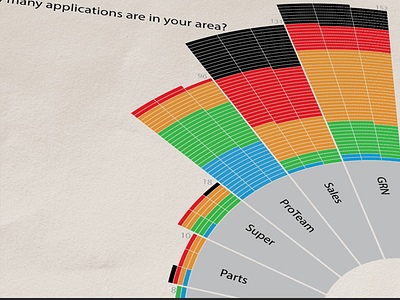

Infographic of applications per area. Colours represent risk to give a quick glance-able overview of which area has the most apps which need the most attention.
Infographic of applications per area. Colours represent risk to give a quick glance-able overview of which area has the most apps which need the most attention.