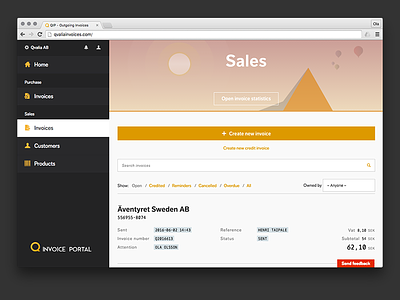
Data driven graphics
We're using statistic data to make graphics when it’s not used. Rather than grouping the light statistics in Qvalia Invoice Portal in a separate page we use it in the top of every section to create a beautiful graphic to lighten up the advanced UI. In addition, we provide the user with a hard core statistics panel free from soft values in a separate section.
View all tags
Posted on
Jun 2, 2016
More by Ola Olsson View profile
Like

