Audience Intelligence


Tinypass AI (Audience Intelligence) is a super powerful segmentation-driven analytics tool we started developing in late 2013. These two particular reports, Volume and Rhythm, are some of the first visualizations I designed and prototyped.
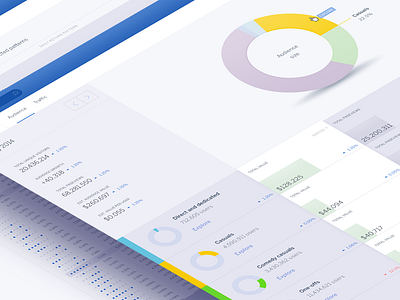
Volume measures the month-to-month ingress, egress and movement of your audience between custom-defined segments, while Rhythm visualizes the daily/weekly/monthly visitation patterns found in your audience, unique to every single user. These comps are sharing actual data from an enterprise news site who was our very first integration partner for this product.
AI, as a product, is both the data-tracking software, a large suite of rich visualizations, and an engine for driving user-tailored experiences in other areas of our new platform.
I spent a lot of time in both Scriptographer (Javascript for Illustrator) and Python (in Cinema4D) for prototyping these report designs and filling them with real datasets I massaged with our team.
Rhythm gave us a super interesting insight for this particular news site. Examine the top recurring visitation patterns found here. It's no surprise the vast majority of users tend to visit once or twice a week (most often on Fridays). What surprised us was the next most prevalent pattern were users who came every single day of the week, including weekends. Using AI, this small but highly devoted audience sub-segment (all users who come 7 days a week, every week, with some decay accounted for) can than be examined/explored further in other areas of the product.