Prague

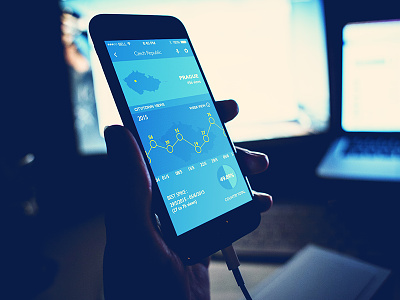

The last screen of the 'views' series showing scrollable chart data for the selected city/town. Since location is quite granular, the data scale, depending on the user's stats, doesn't change that much
Chart design was inspired by @armand 'New Stat View'. Check out the attachment for the dribbble and behance interface comparison.