


Helix


Hi Everyone,
Helix is a cycling data visualization application, that enables you to quickly gather and study important data out of your daily rides.
Cyclists usually need to follow their progress meticulously, and having valuable information easily accessible is crucial for their seasonal plans and training goals.
I’ve decided to work on a concept for the summary screen, which is what you see first when you open the application.
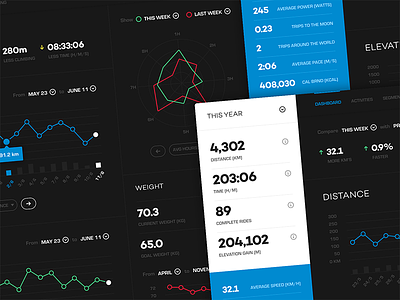
On the left sidebar module you can easily access statistics to get an instant breakdown of how many kilometres you’ve ridden in a given time period, together with variables such as: average power output, average speed, elevation, time, pace, calories burned, and of course, how much is yet left for a trip to the moon! The user should be able to configure this module as he wishes to bring him exactly the type of information necessary. The same can be said for other modular components throughout the application.
In the main section right at the top, we can easily compare time periods to quickly get an overview of what you’ve been doing. For example, in the previous week your power output was lower. Alone this value doesn’t bring too much information, but coupled with variables such as for example: elevation gain, pace, and distance, we can start gathering important conclusions by comparing this data with data from another time period.
Of course, we also need a way to easily visualize and analyze progress besides using just pure numbers as a reference. Each line chart can be filtered easily within a user specified time frame and set for distance, elevation, power output, and pace, among others.
On the right side we can find a compass chart for another visualization option. Do you want to easily know the average amount of hours that you spent this week in each ride, compared with the previous week? And what was the most common amount of time you spent riding? 8 hours? 4 hours?
Additionally, weight is an important factor to put on the table, as it’s most likely one of the most important values to take into consideration on a cyclist performance. You can easily see your current weight, and set your goal weight. Bellow is a weight evolution chart within a specified time period to quickly track weight evolution over time.
To conclude, the main objective was to design a simple, and upfront hub for your cycling progress with easily user configurable modular components to fit as many use cases as possible.
Please make sure you check out @2x preview and the attachment.
Attachments:
helix-2x.png