Statistics for Esports Analytics Web Dashboard

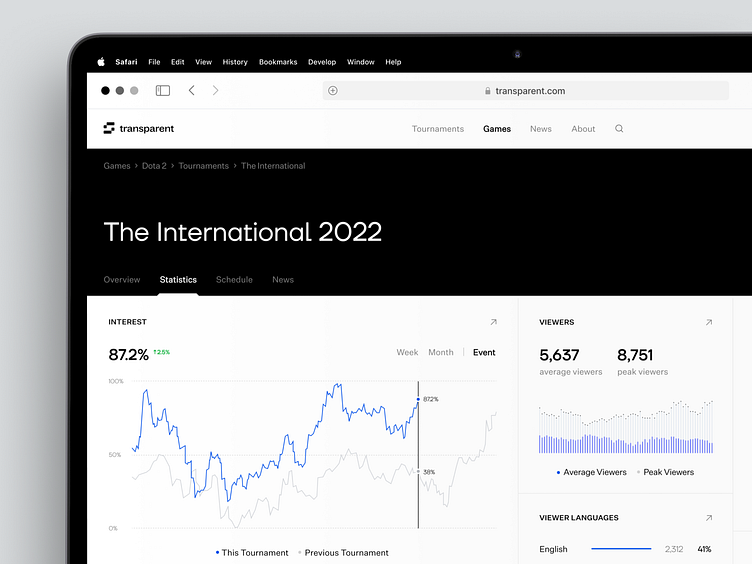
This shot presents detailed statistics for a certain tournament from an esports dashboard concept. The user can see clear diagrams showing the popularity of the show during the week or month. Moreover, it can be compared with data from the previous tournament to see the changes in dynamics. This is crucial for preparing efficient strategies. For better understanding, the dashboard provides statistics about the viewers, like numbers and languages. To make all these data easy to notice and navigate, we stick with a plain black&white color scheme.
Let's collaborate!
hi@conceptzilla.com
Discover more about us at conceptzilla.com