Small businesses graphs and charts


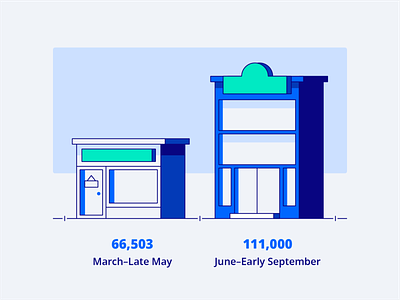

The legal industry our client was from naturally tends to use plenty of charts and graphs to explain things. Keeping that in mind, our team didn’t want to drown the reader in boring squares and circles but has instead envisioned a way to add a dash of creativity, like we did with this fully illustrated bar graph, which depicts the number of new business applications in different stages of the pandemic.