Libmanage Dashboard UI Elements


Hello, Players! 🏀 🙌
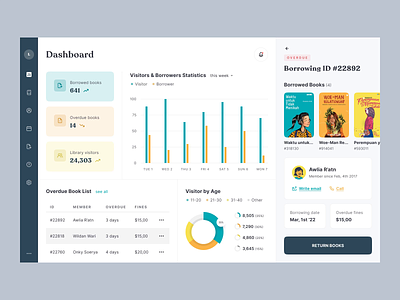
Libmanage is one of my newest design explorations, it's a library management dashboard created with Figma. And now here I am, trying the newest and cool Dribbble Case Study feature to re-present and break down the UI elements of the design.
Before we begin, let's start by reminding you of the design exploration I posted earlier some days ago.
Libmanage Dashboard ― ☀️ Light & 🌘 Dark Animation
Hello, Players! 🏀🙌
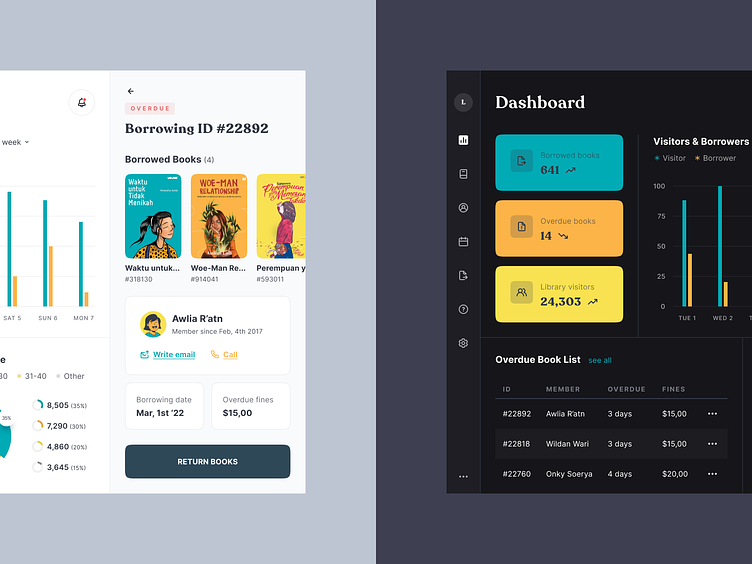
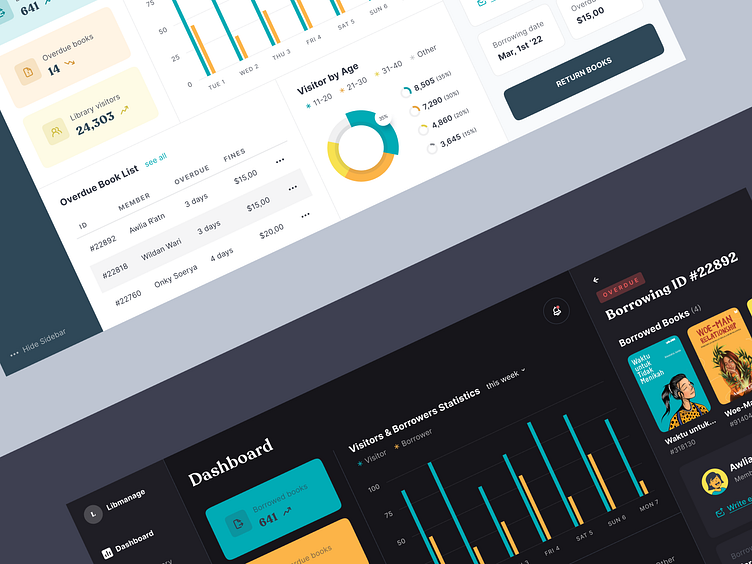
Here's my latest exploration of a library management dashboard called Libmanage. I'm adding the interaction for the light and dark mode. Swipe for more details.
What do you guys think? Let me know in the comments section. Hope you guys enjoy it. Thanks for the likes ❤️ and comments.
-----------------------
Have a good project? Let us know ✅
💌 10am Email: Message us
😍 10am Instagram: Follow us
🥳 10am Product: Creative Market / Gumroad / UI8
-----------------------
I'm available for freelance projects. So let's talk or hit me up through email at thevickypradana@gmail.com
Also follow me on Instagram @thevickypradana
Now if you're ready, let's get into it. 👇
⎯
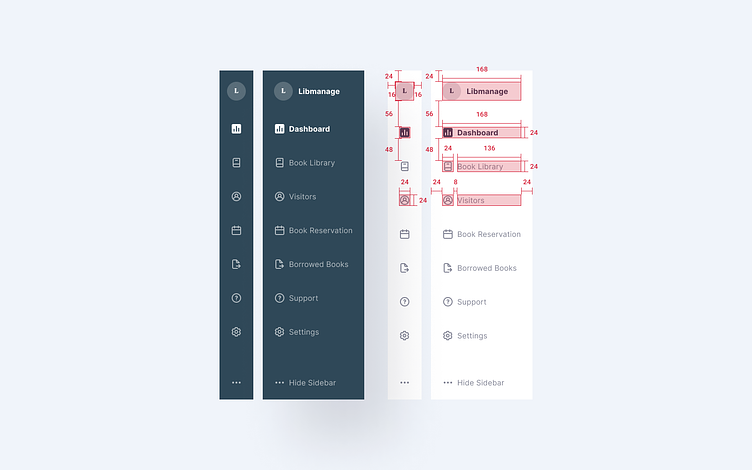
Sidebar Navigation Element
Here is the Sidebar Navigation element, where Library Admin could browse into the different pages and sections of the app.
All elements and spacing are carefully crafted with a basic 4px grid to keep them consistent.
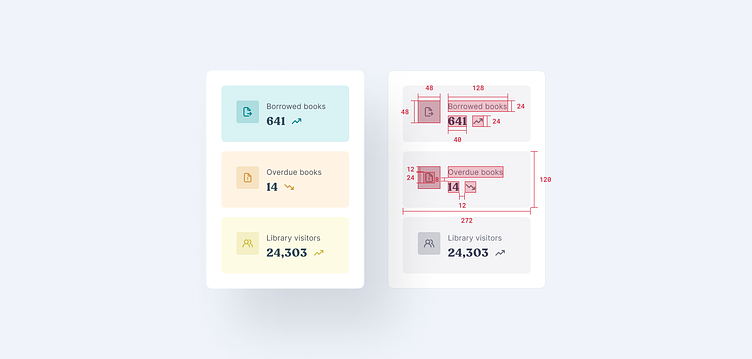
Quick Summary Element
Here is the quick summary element I created, every data is separated by different colors to make the Library Admin scan the data easier.
All elements and spacing are also carefully crafted with a basic 4px grid to keep them consistent.
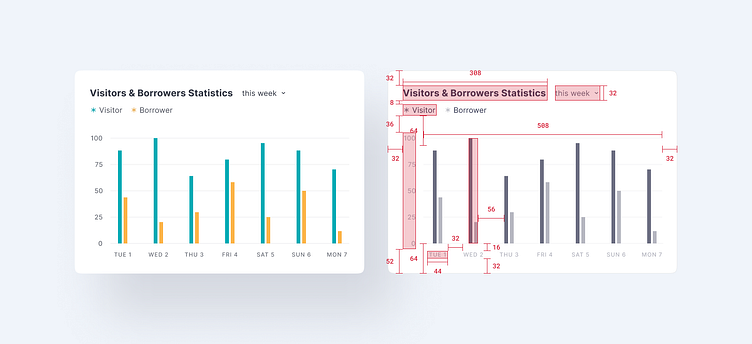
Visitors & Borrowers Statistics (Bar Chart Element)
Here is the bar chart element I created, still separated by a different color for each value. Library Admin could also filter the data by selecting the different values on the dropdown element.
All elements and spacing are also carefully crafted with a basic 4px grid to keep them consistent.
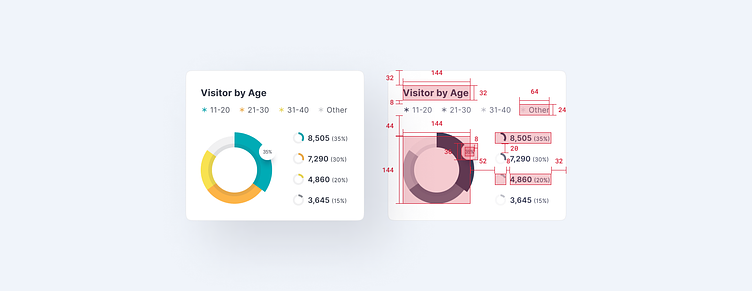
Visitor by Age (Pie Chart Element)
Here is the pie chart element I created, separated by a different color for each value. The Library Admin can hover over any of the elements to see the percentage value, the full value is displayed right next to the chart.
All elements and spacing are carefully crafted with a basic 4px grid to keep them consistent.
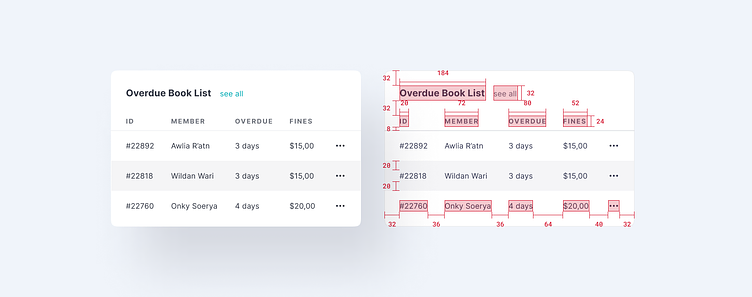
Overdue Book List (Table Element)
In this one, the Library Admin could see every overdue book list at a glance, they could also see all the list by clicking on the link, which will bring them to the dedicated borrowed books page with the overdue status.
All elements and spacing are also carefully crafted with a basic 4px grid to keep them consistent.
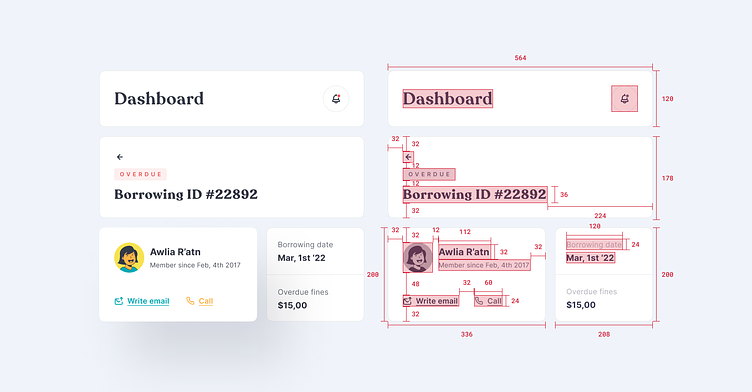
Other Elements
In the last one, I tried to collect the other elements I've used on the project. Here are the Page Title element, Section Title element, library member, and the borrowing details.
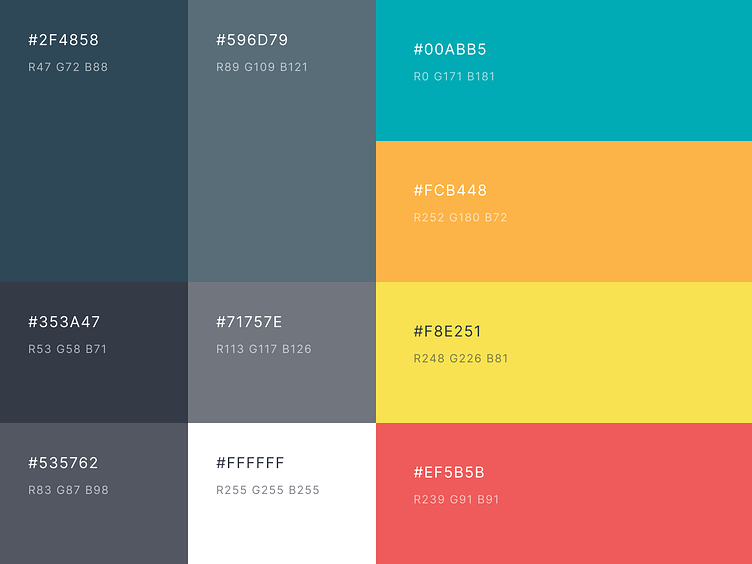
The Colors
⎯
What do you guys think? Let me know in the comments section. Hope you guys enjoy it. Thanks for the likes ❤️ and comments.
Have a good project? Let us know ✅
💌 10am Email: Message us
😍 10am Instagram: Follow us
🥳 10am Product: Creative Market / Gumroad / UI8
I'm available for freelance projects. So let's talk or hit me up through email at thevickypradana@gmail.com
Also follow me on Instagram @thevickypradana